Market analytics at the time was fragmented, with siloed solutions that made it hard to see the big picture. Concentric's underlying technology aggregated multiple data sets and leveraged agent-based modeling, machine learning, and behavioral science to simulate market dynamics with remarkable precision.
My task was to design an intuitive, user-friendly interface that would enable business leaders to visualize their current state and explore 'what-if' scenarios across key domains such as marketing, finance, product development, and supply chain management.
My Role
Strategy, Interaction Design, Visual Design, Prototyping
Team Members
Strategist, UX/UI Designer, Project Manager, Front-End Developer
Timeframe
4 Months
Discovery & Approach
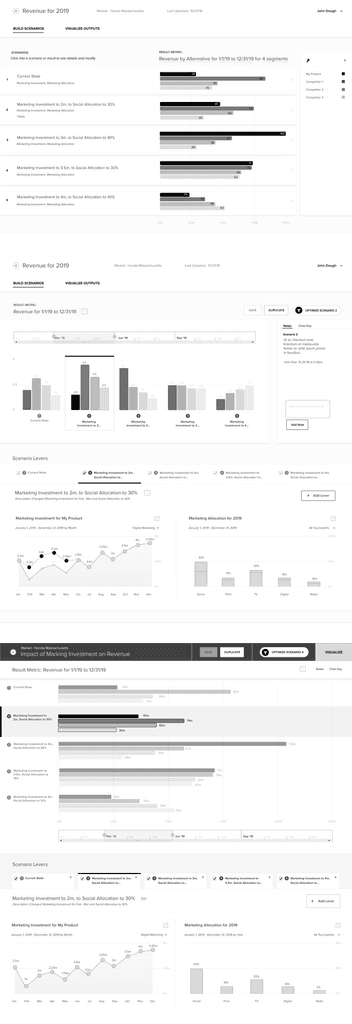
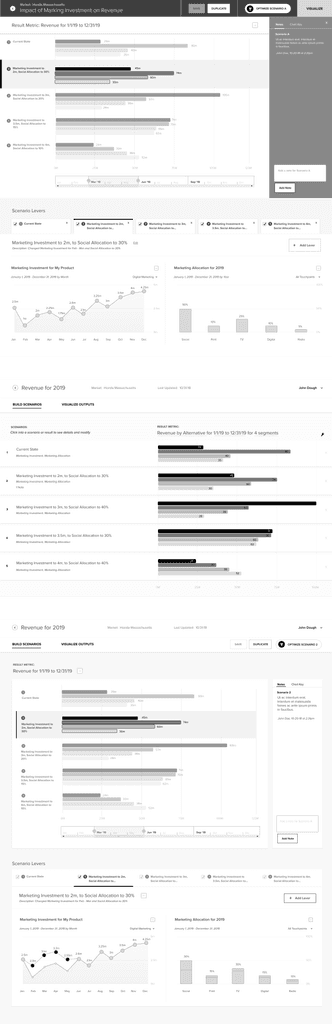
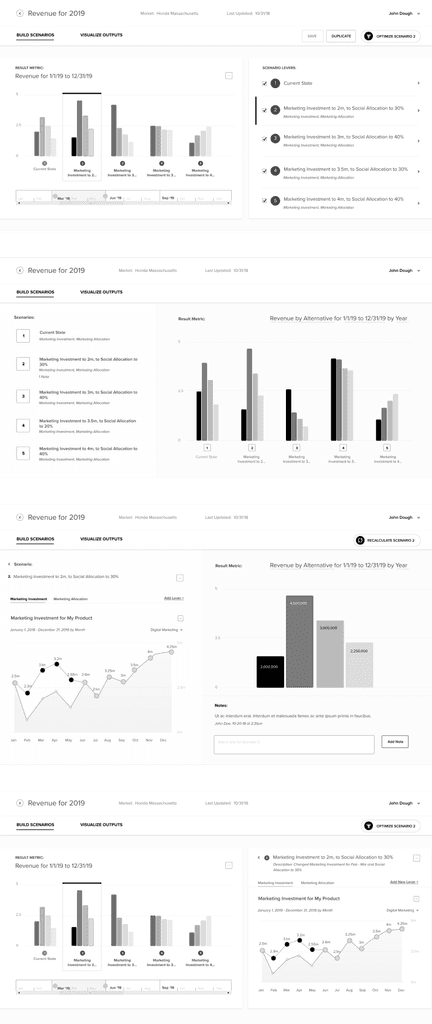
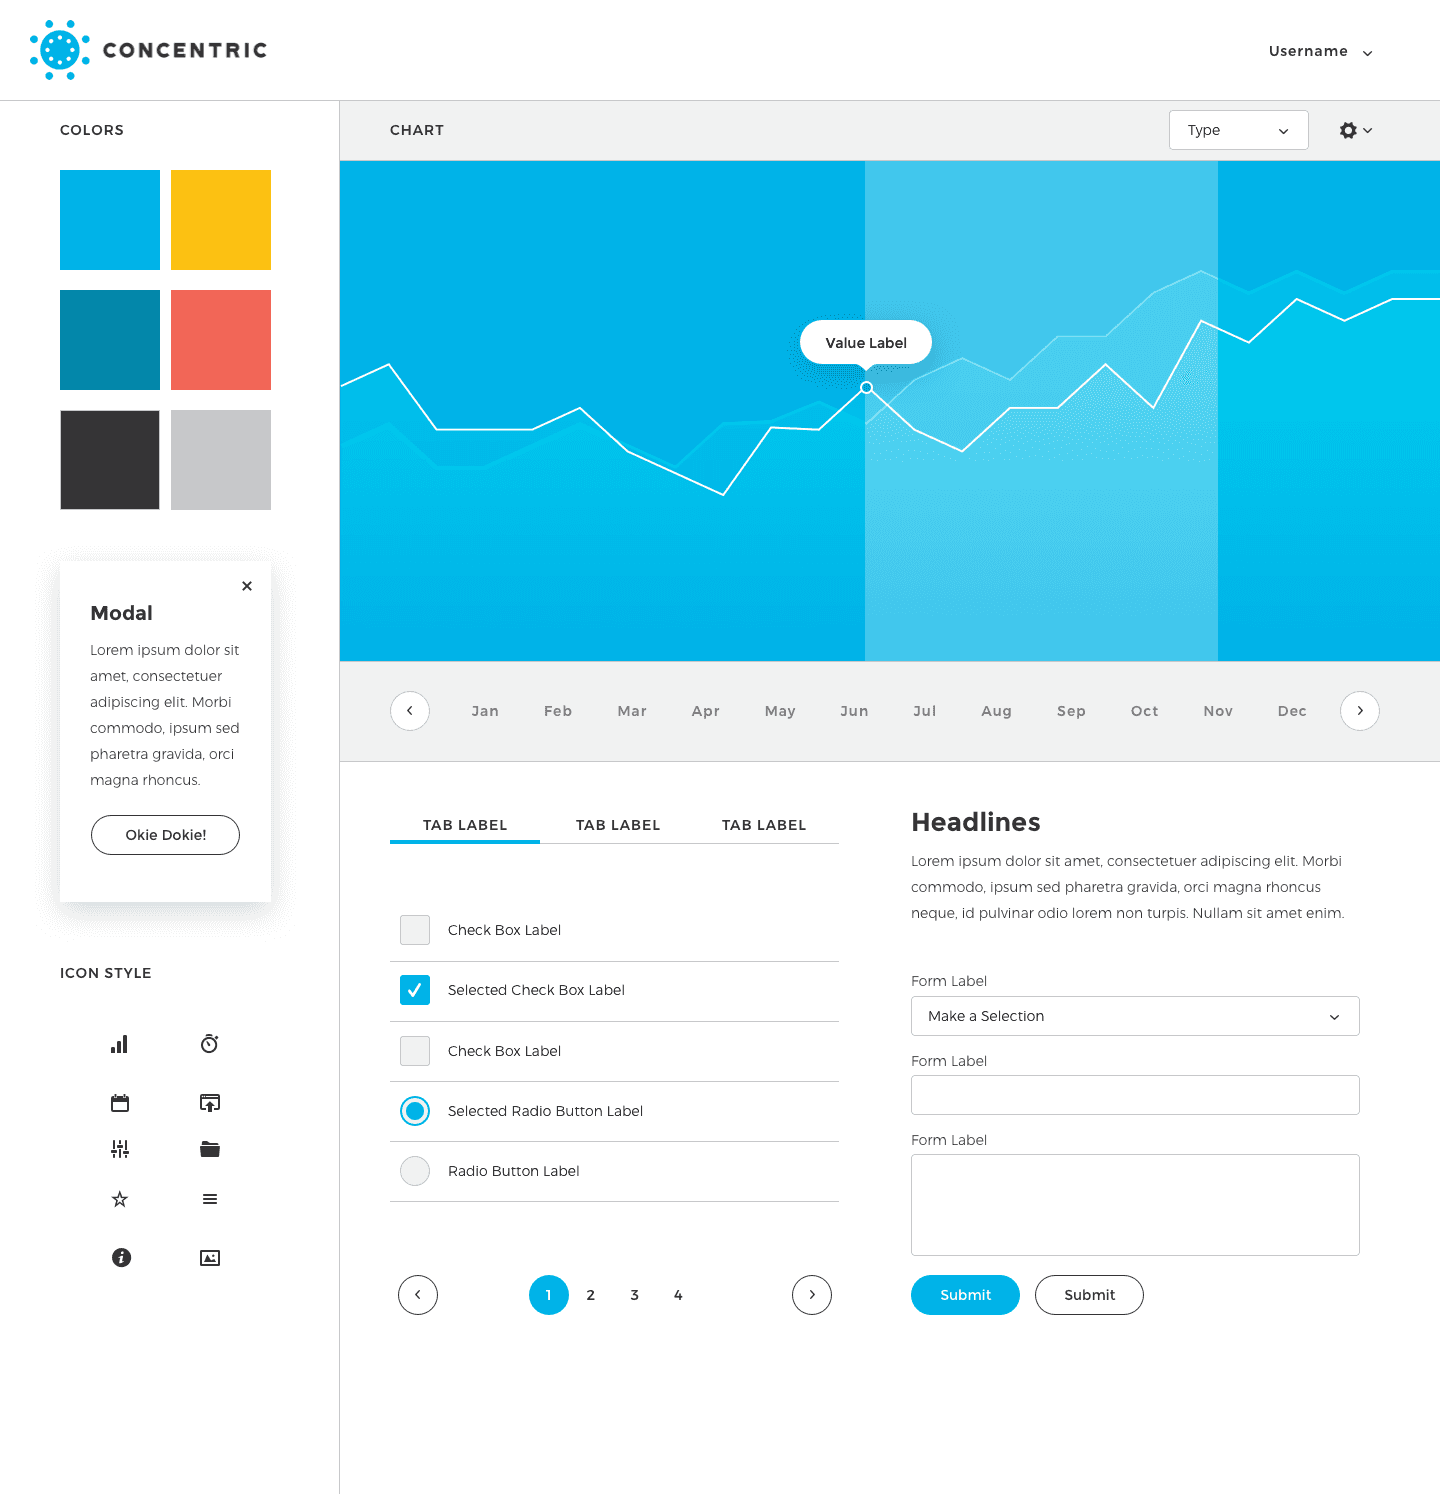
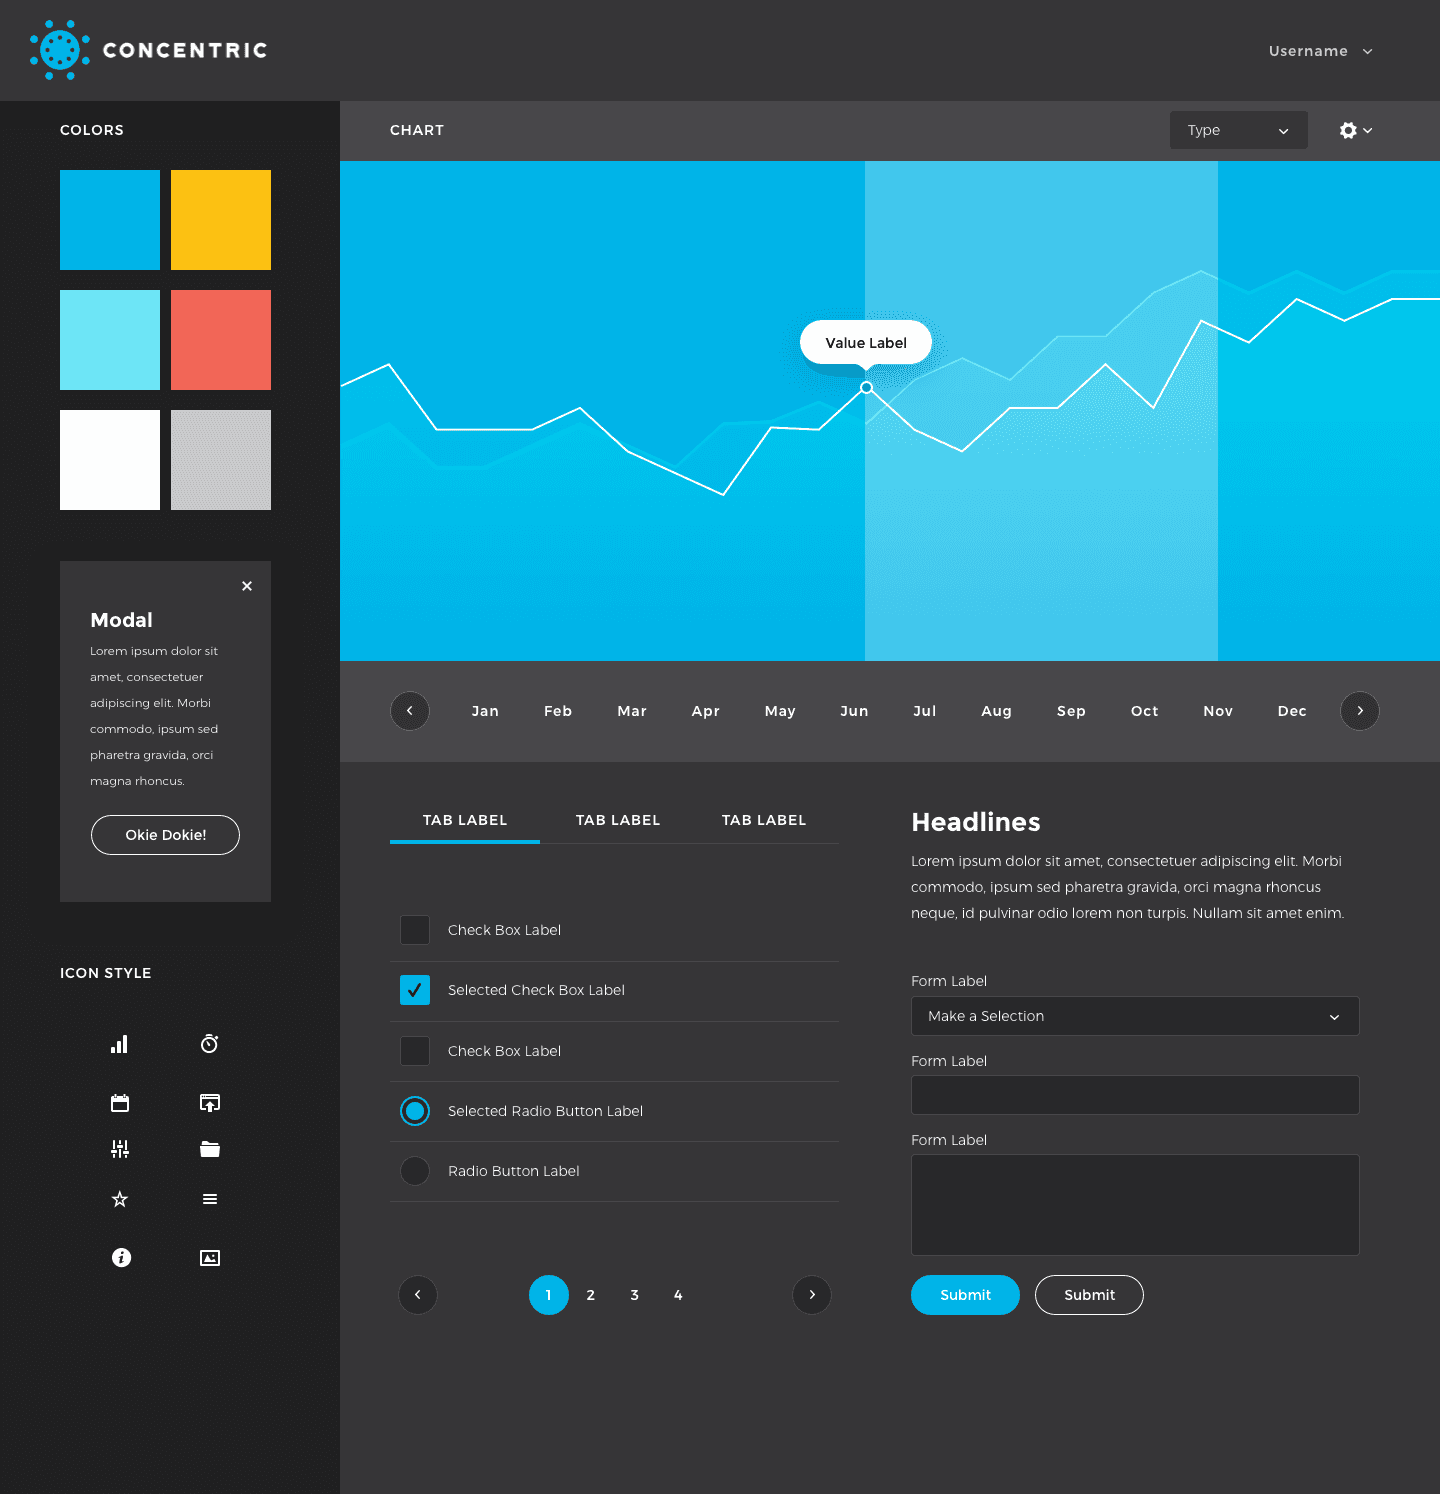
The team and I began with a deep dive into Concentric's technology and existing customer base. During our research, I mapped core workflows that would form the product's structure. Following an iterative design process, I moved from rough sketches to high-fidelity wireframes, with each version tested and refined. Below are some early wireframes that explored different layouts and interaction models.
Visual exploration
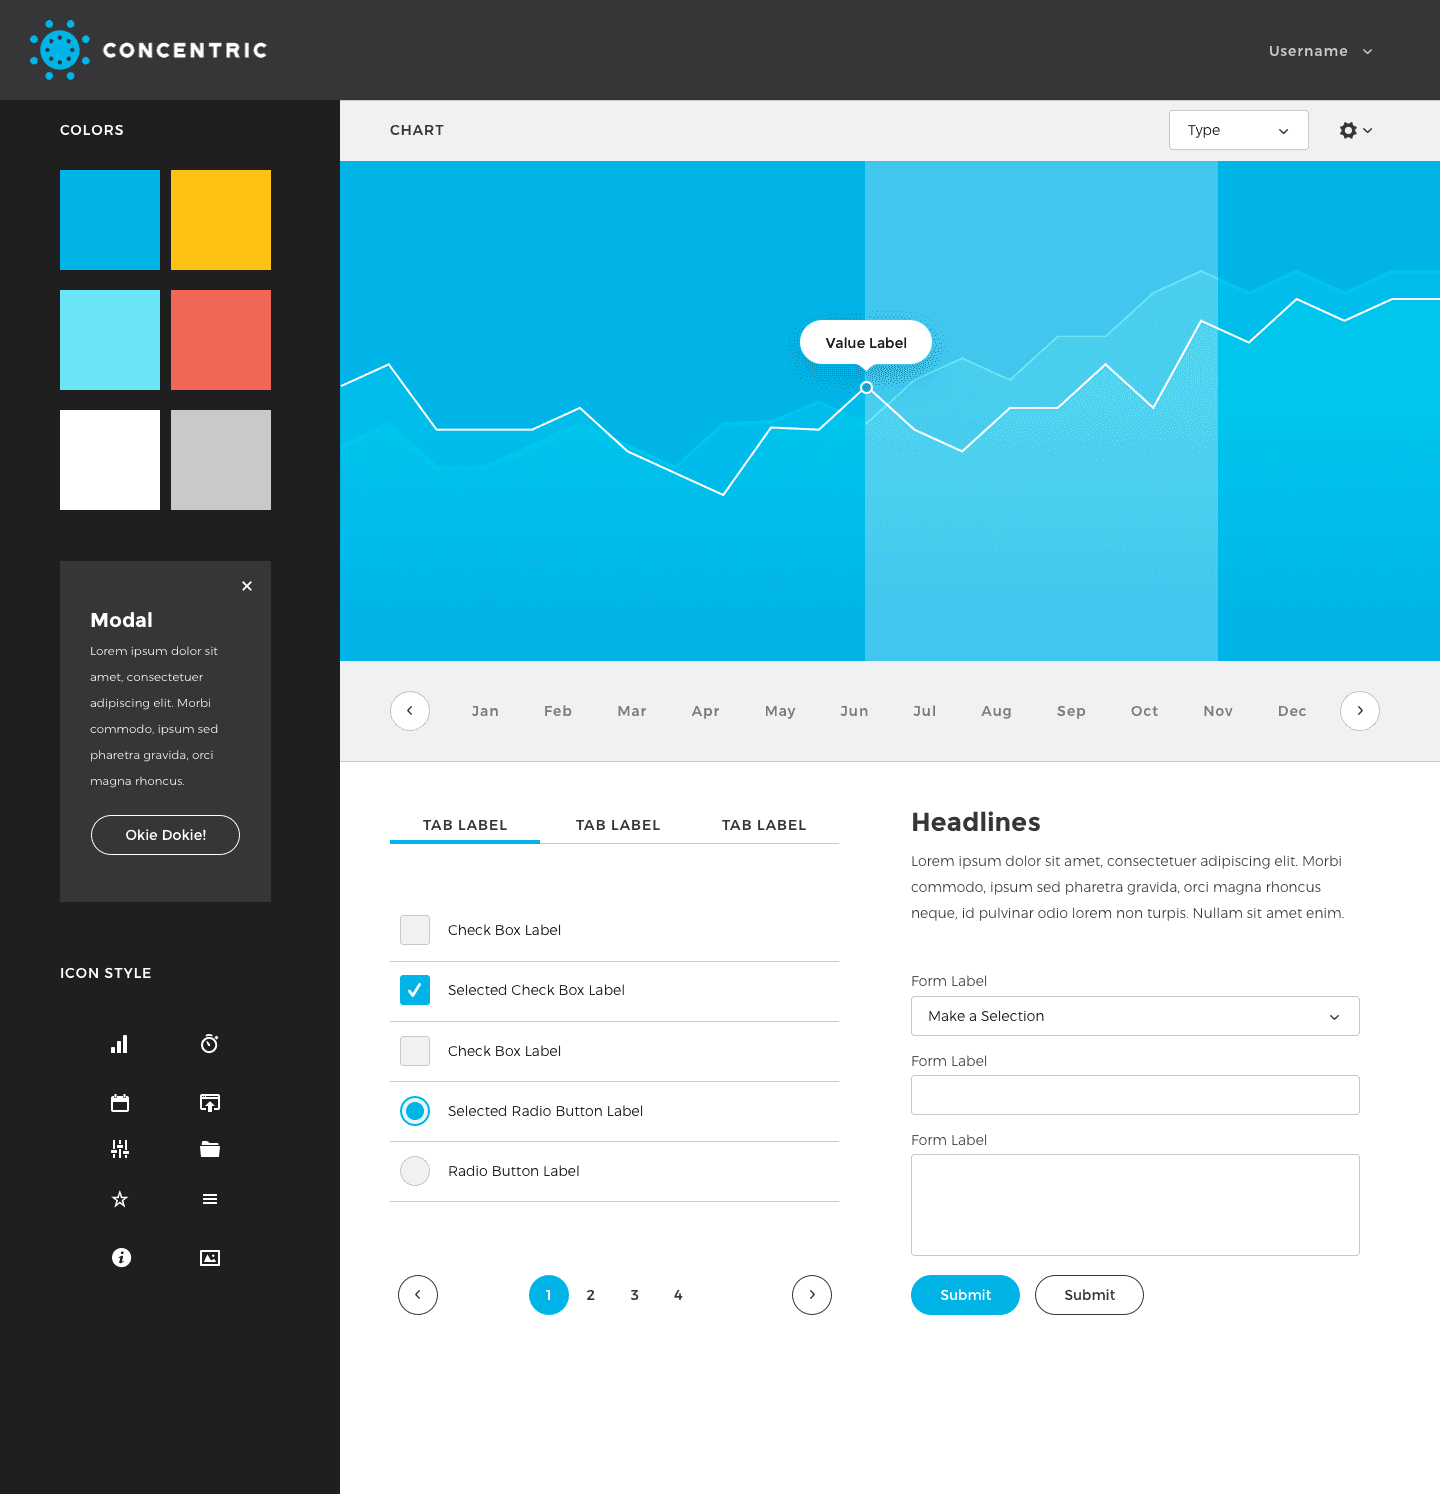
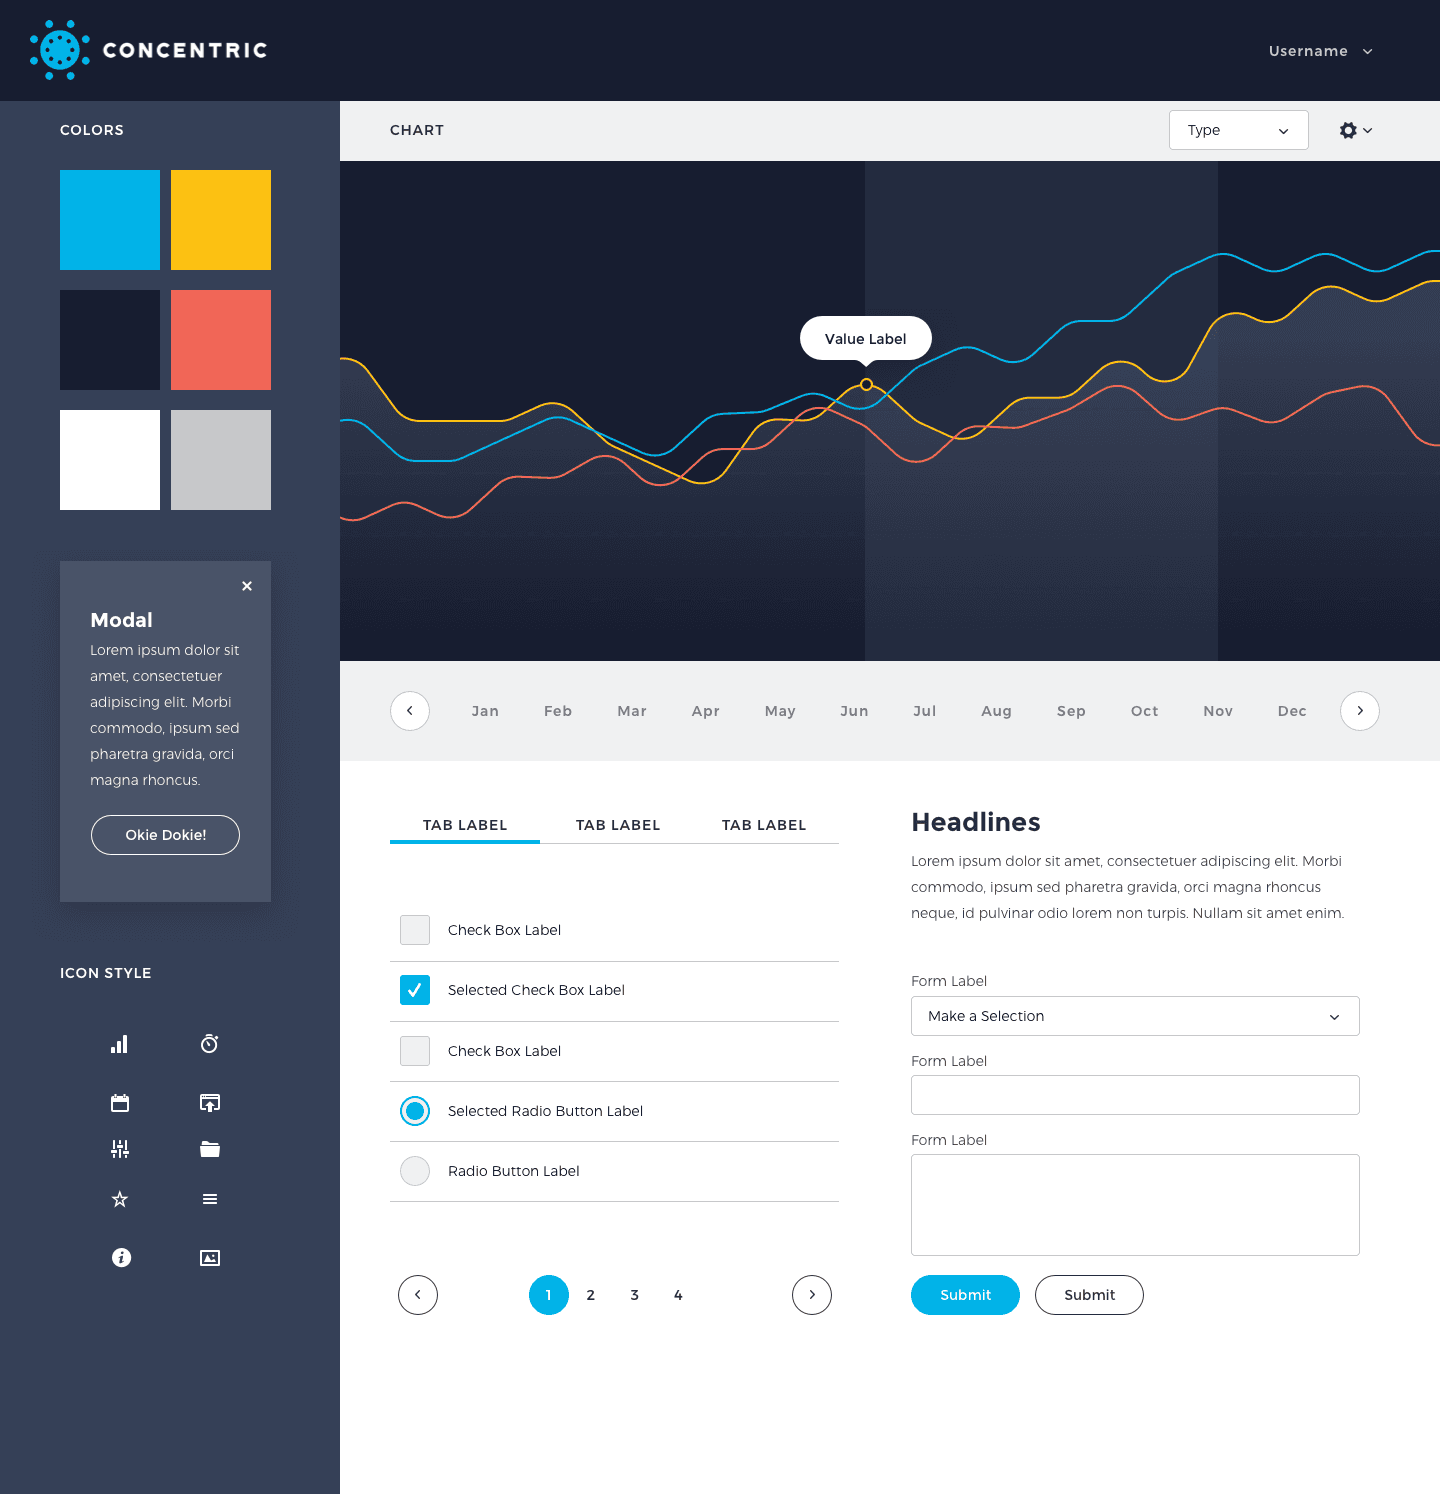
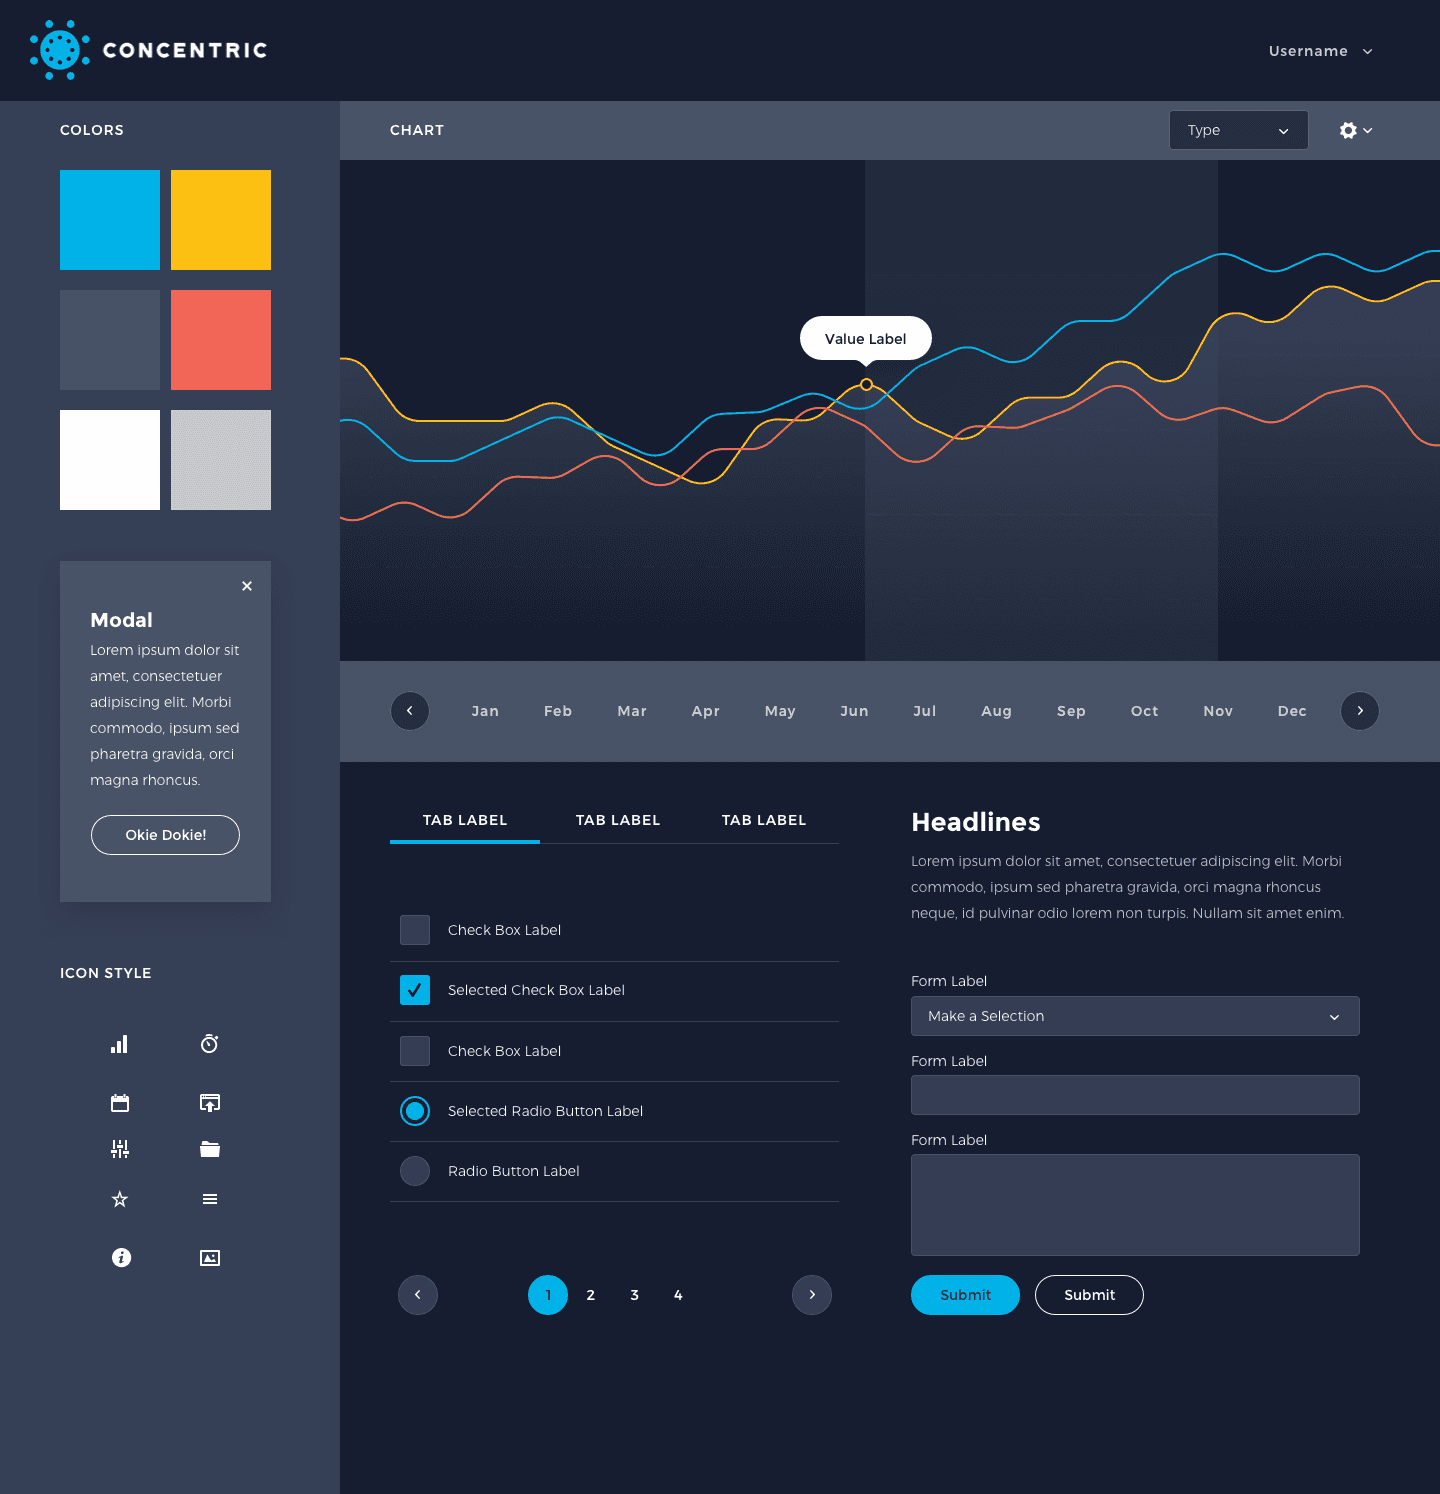
As the wireframes evolved, I simultaneously explored potential interface aesthetics, focusing on how color and contrast could shape the product's overall look and feel and align with their brand.
Since completing this project, awareness around accessibility has grown significantly. While the solution successfully addressed the core challenges at the time, the color contrast ratios don't meet current WCAG standards in all cases which is something I would now consider a fundamental requirement.

Final product experience
The final solution delivered a unified, self-service platform that empowered business leaders to easily create and refine scenarios. A standout feature was the intuitive Mad Lib-style sentence structure, supported by real-time data visuals that immediately reflected results.
Designed with collaboration in mind, the platform offered seamless data sharing and presentation creation within a single interface. Feedback was overwhelmingly positive, with users praising its intuitive design and its ability to drive faster, more informed decision-making.
Outcomes
Navigated a complex technical domain.
Aligned product design aesthetic with new marketing direction.
Designed a unified platform for scenario experimentation and reporting.
Accelerated scenario planning and decision-making, reducing costs.
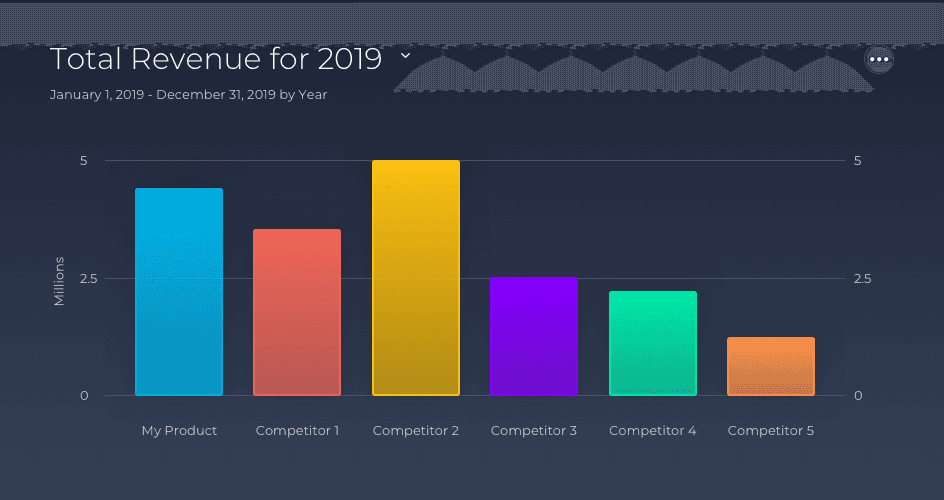
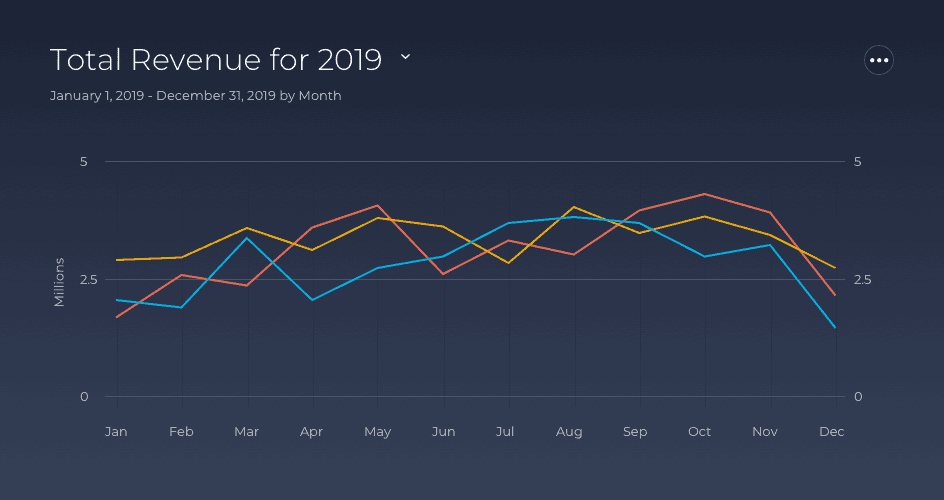
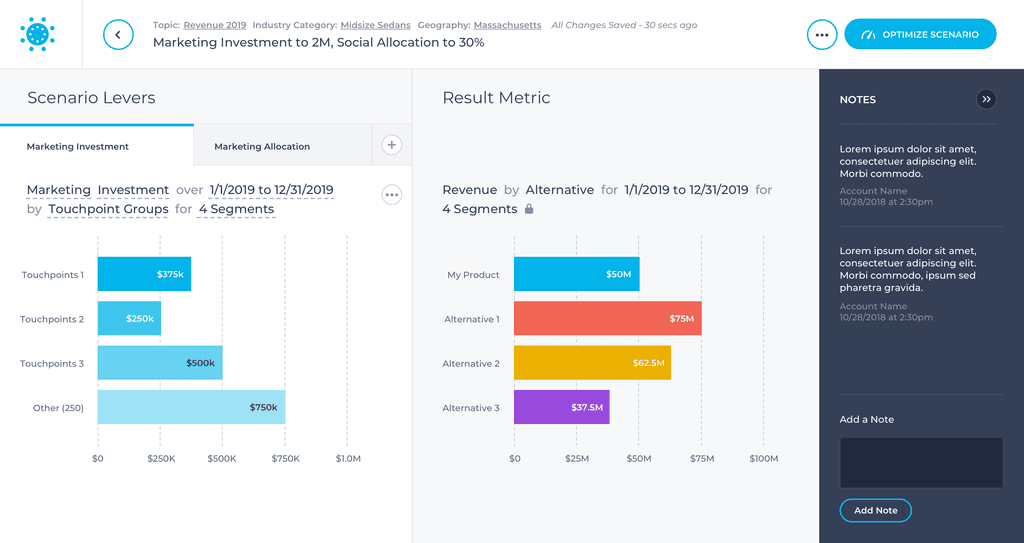
"What's our current state and what scenario creates the largest impact?"
Surfaced current state and experimental scenario data visuals for quick comparison and analysis.
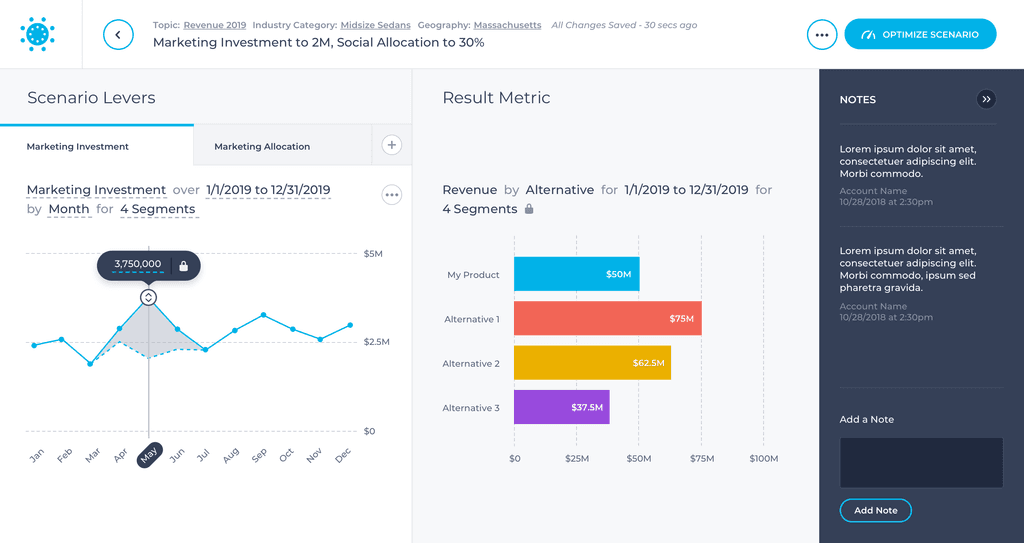
"What is our current investment, and what result did it have?"
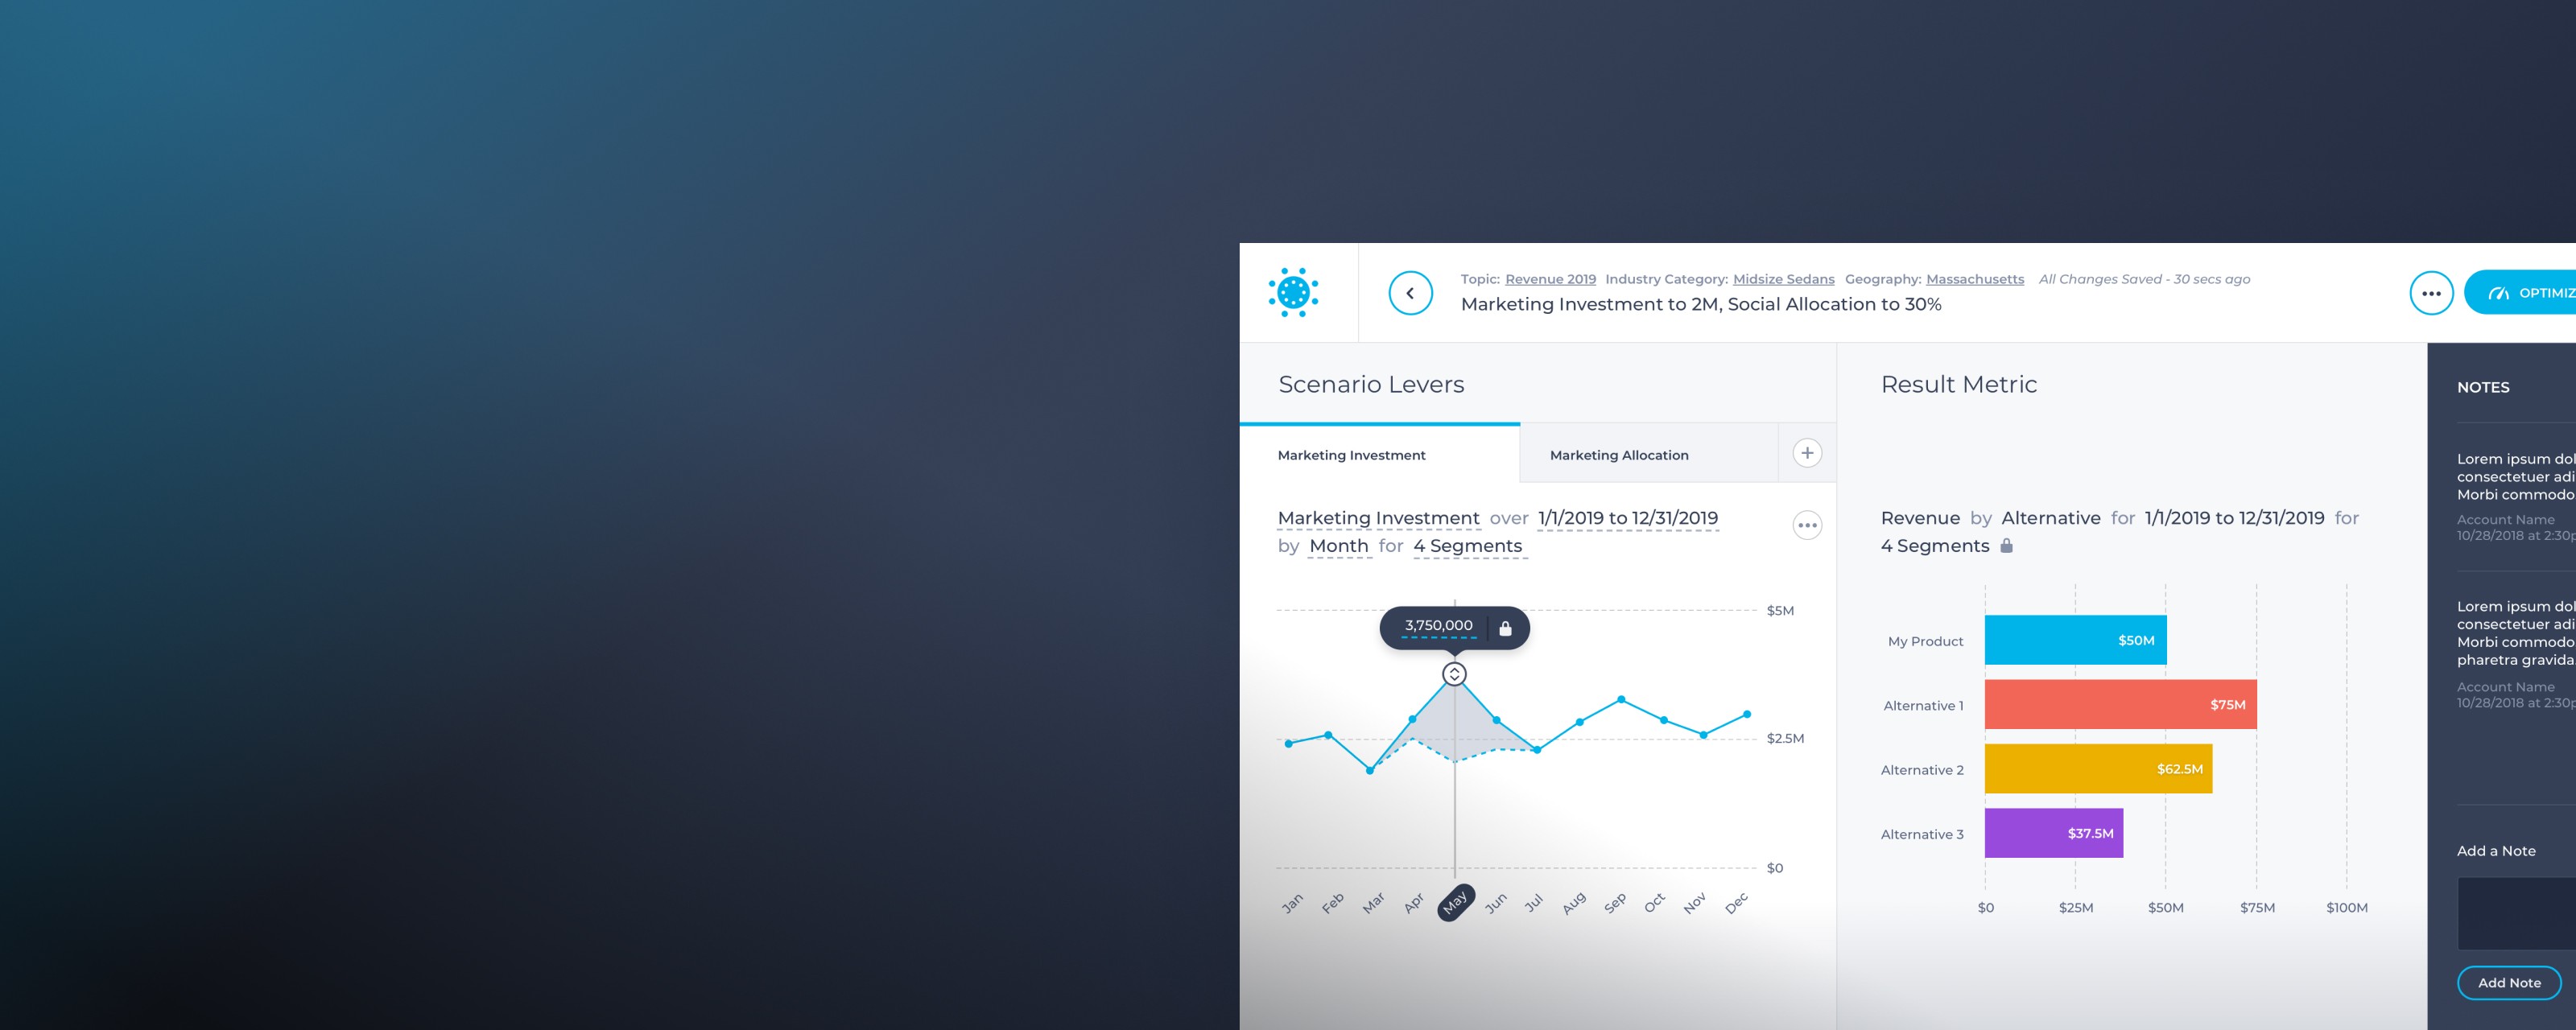
Engaging Mad Lib-style sentence structure used to configure the scenario and data visual below.
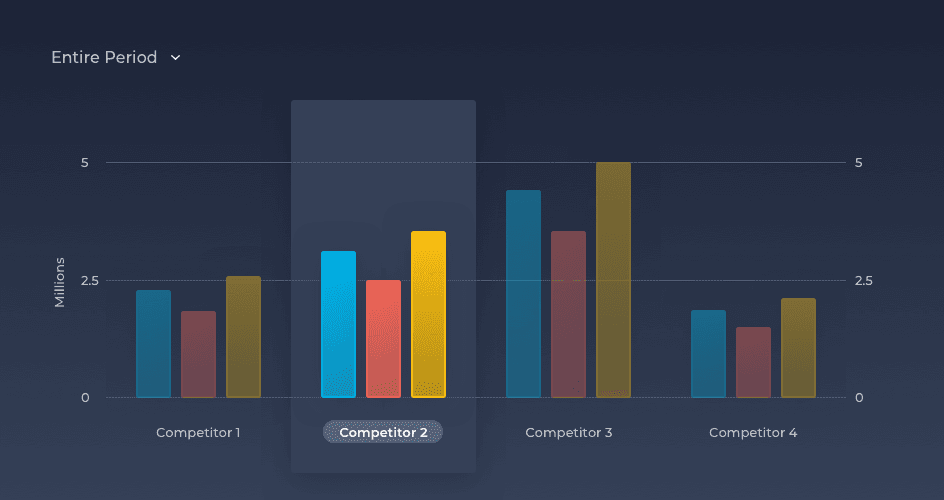
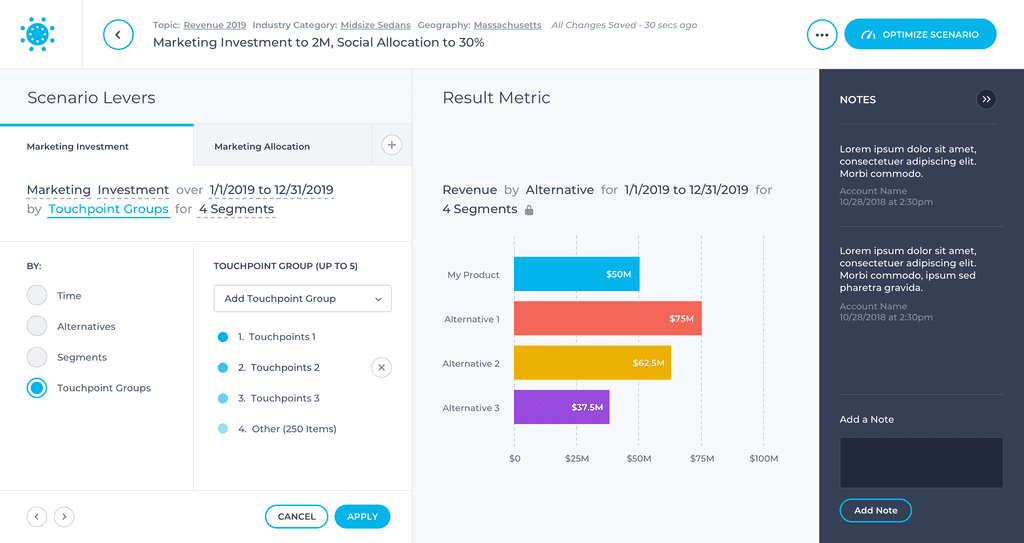
"Which specific investment contributed to the result?"
Conserved screen real estate and avoided confusion by utilizing the same space as the data visual when modifying the scenario levers.
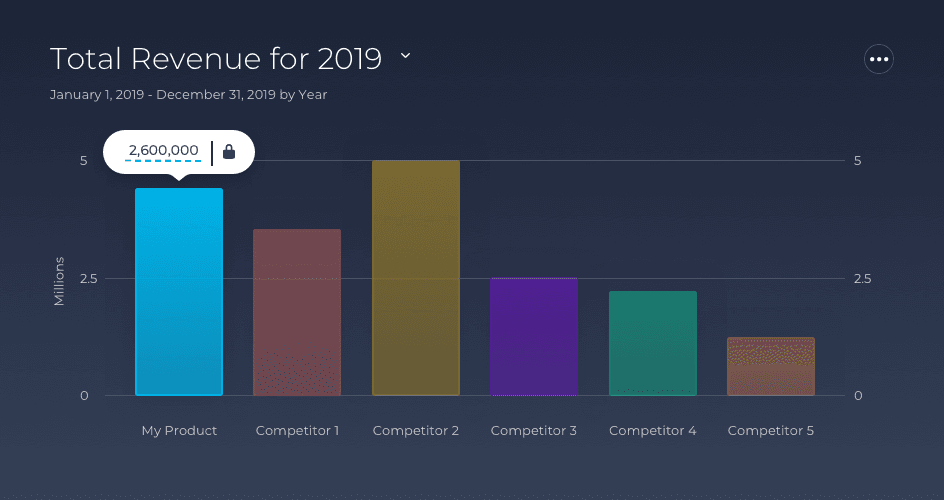
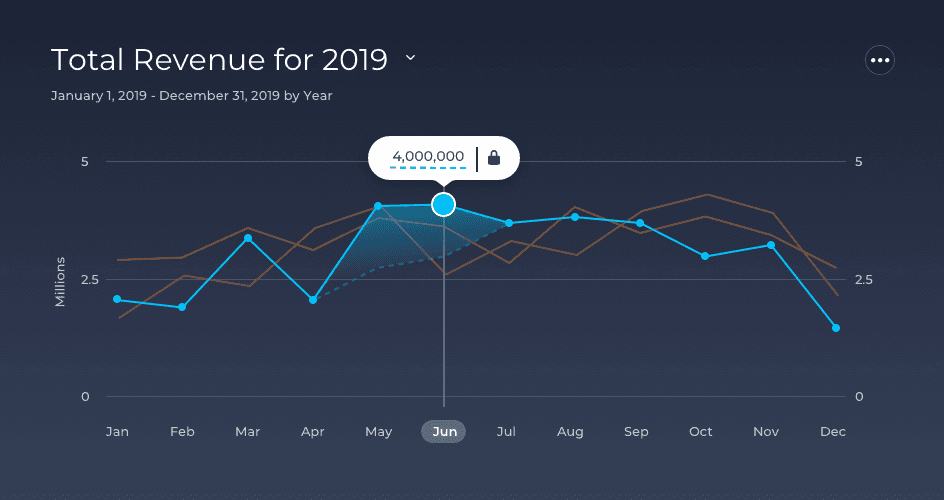
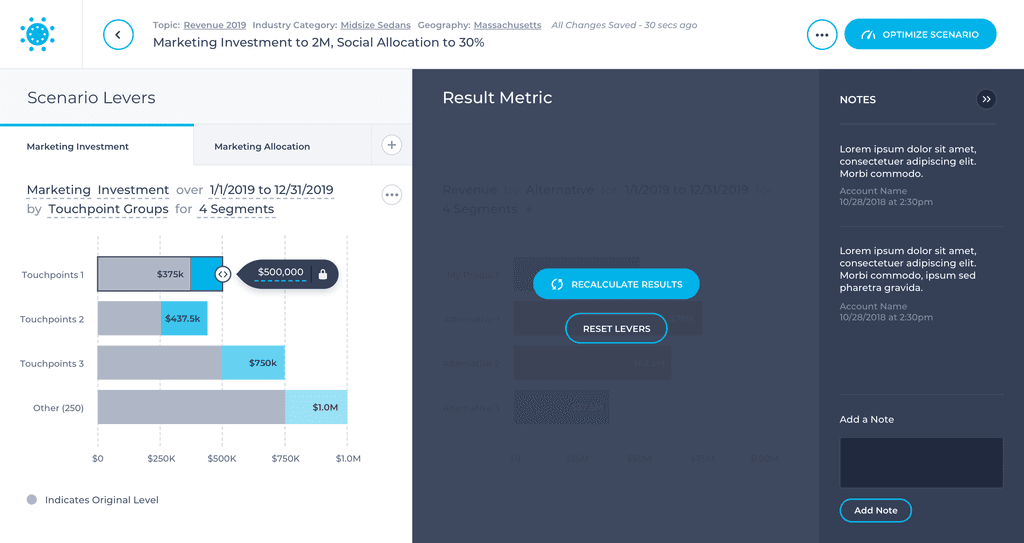
"If we increased investment in one area, how might that impact the result?"
The data visuals were interactive allowing for quick modifications to the scenario.
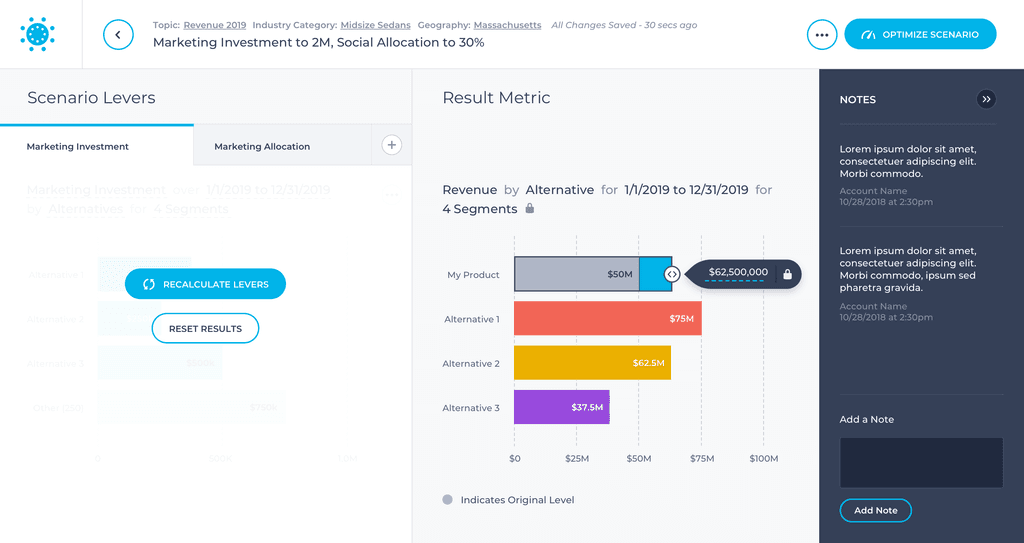
“What investment could I make to obtain this desired result?”
Manipulating a result would forecast lever changes in order to achieve it.
"What would happen if we made investment adjustments over time?"
Different data types influence the design of data visuals and interactions.
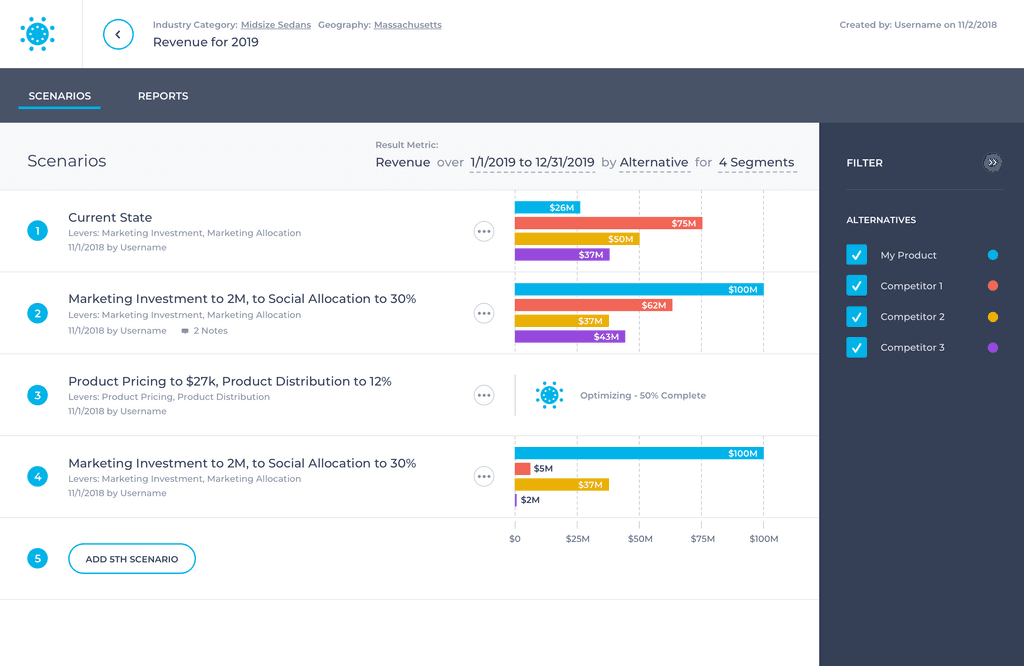
"I want to share this scenario with others so they can explore the impact."
Interactive reports enabled further exploration and easy sharing with others.
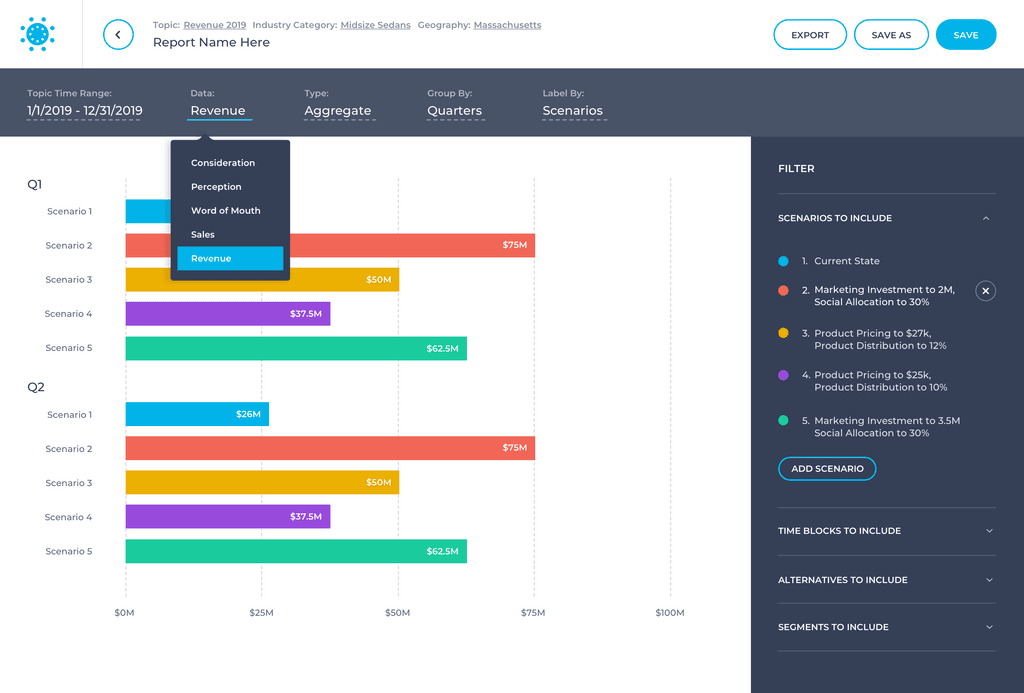
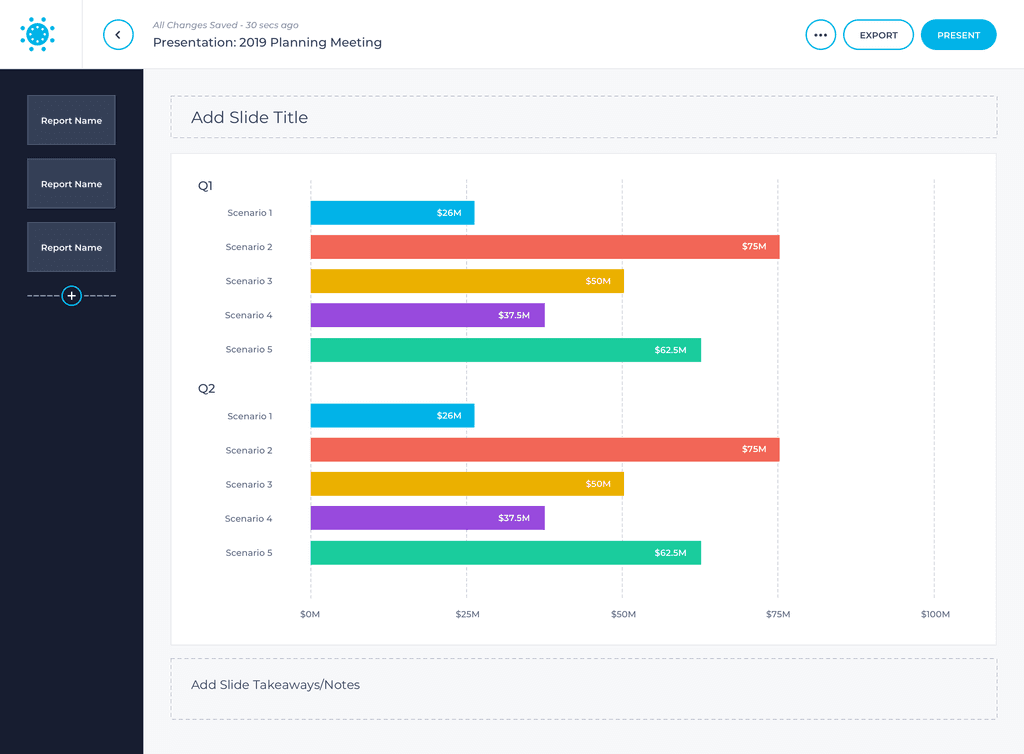
"I want to quickly generate a presentation from specific scenarios."
Static views of the reports could then be compiled into a deck for presentation providing a one platform solution.