Shyft Analytics

Shyft Analytics

Bringing efficiency and insight to clinical trials

Bringing efficiency and insight to clinical trials

Bringing efficiency and insight to clinical trials

Shyft Analytics

Bringing efficiency and insight to clinical trials

SHYFT, a leader in healthcare analytics, set out to revolutionize the way clinical trial data was managed and analyzed.

Pharmaceutical companies often face delays in defining disease parameters and analyzing patient cohorts, a process that can take weeks or months, wasting resources and discarding studies.

SHYFT needed a solution to help business analysts without programming skills quickly conduct high-confidence preliminary studies and focus on promising research.

The objective was to provide a guided approach to help non-technical users navigate complex clinical and claims data sets.

My Role

My Role

My Role

Strategy, Interaction Design, Visual Design, Prototyping, Usability Testing

Strategy, Interaction Design, Visual Design, Prototyping, Usability Testing

Strategy, Interaction Design, Visual Design, Prototyping, Usability Testing

Team Members

Team Members

Team Members

UX Strategist, UX/UI Designer, Project Manager, Front End Developer

UX Strategist, UX/UI Designer, Project Manager, Front End Developer

UX Strategist, UX/UI Designer, Project Manager, Front End Developer

Timeframe

Timeframe

Timeframe

4 Months

4 Months

4 Months

Key Challenges

Key Challenges

Key Challenges

  • New product with an accelerated timeline.

  • New product with an accelerated timeline.

  • New product with an accelerated timeline.

  • Complex industry and workflows.

  • Complex industry and workflows.

  • Complex industry and workflows.

  • Guided and non-linear user flows.

  • Guided and non-linear user flows.

  • Guided and non-linear user flows.

  • Technical requirements and considerations.

  • Technical requirements and considerations.

  • Technical requirements and considerations.

“This cohort generation process is killing me! It takes weeks, and I’ve got critical research piling up while the business team breathes down my neck.

If I could crank out these cohorts in a day instead of weeks, I’d finally have time to focus on my research and hit these insane deadlines the higher-ups keep throwing at me.”

Technical clinical researcher loving their job *

“This cohort generation process is killing me! It takes weeks, and I’ve got critical research piling up while the business team breathes down my neck.

If I could crank out these cohorts in a day instead of weeks, I’d finally have time to focus on my research and hit these insane deadlines the higher-ups keep throwing at me.”

Technical clinical researcher loving their job *

Understanding & Research

To tackle this problem, we began by thoroughly understanding and mapping the user journey for the current user types.

  • Clinical users: Primarily involved in research, development, and health informatics.

  • Non-technical clinical users: Senior users focusing on interpreting output rather than technical data analysis.

  • Commercial users: Senior, insights-focused individuals responsible for making high-stakes business decisions.​

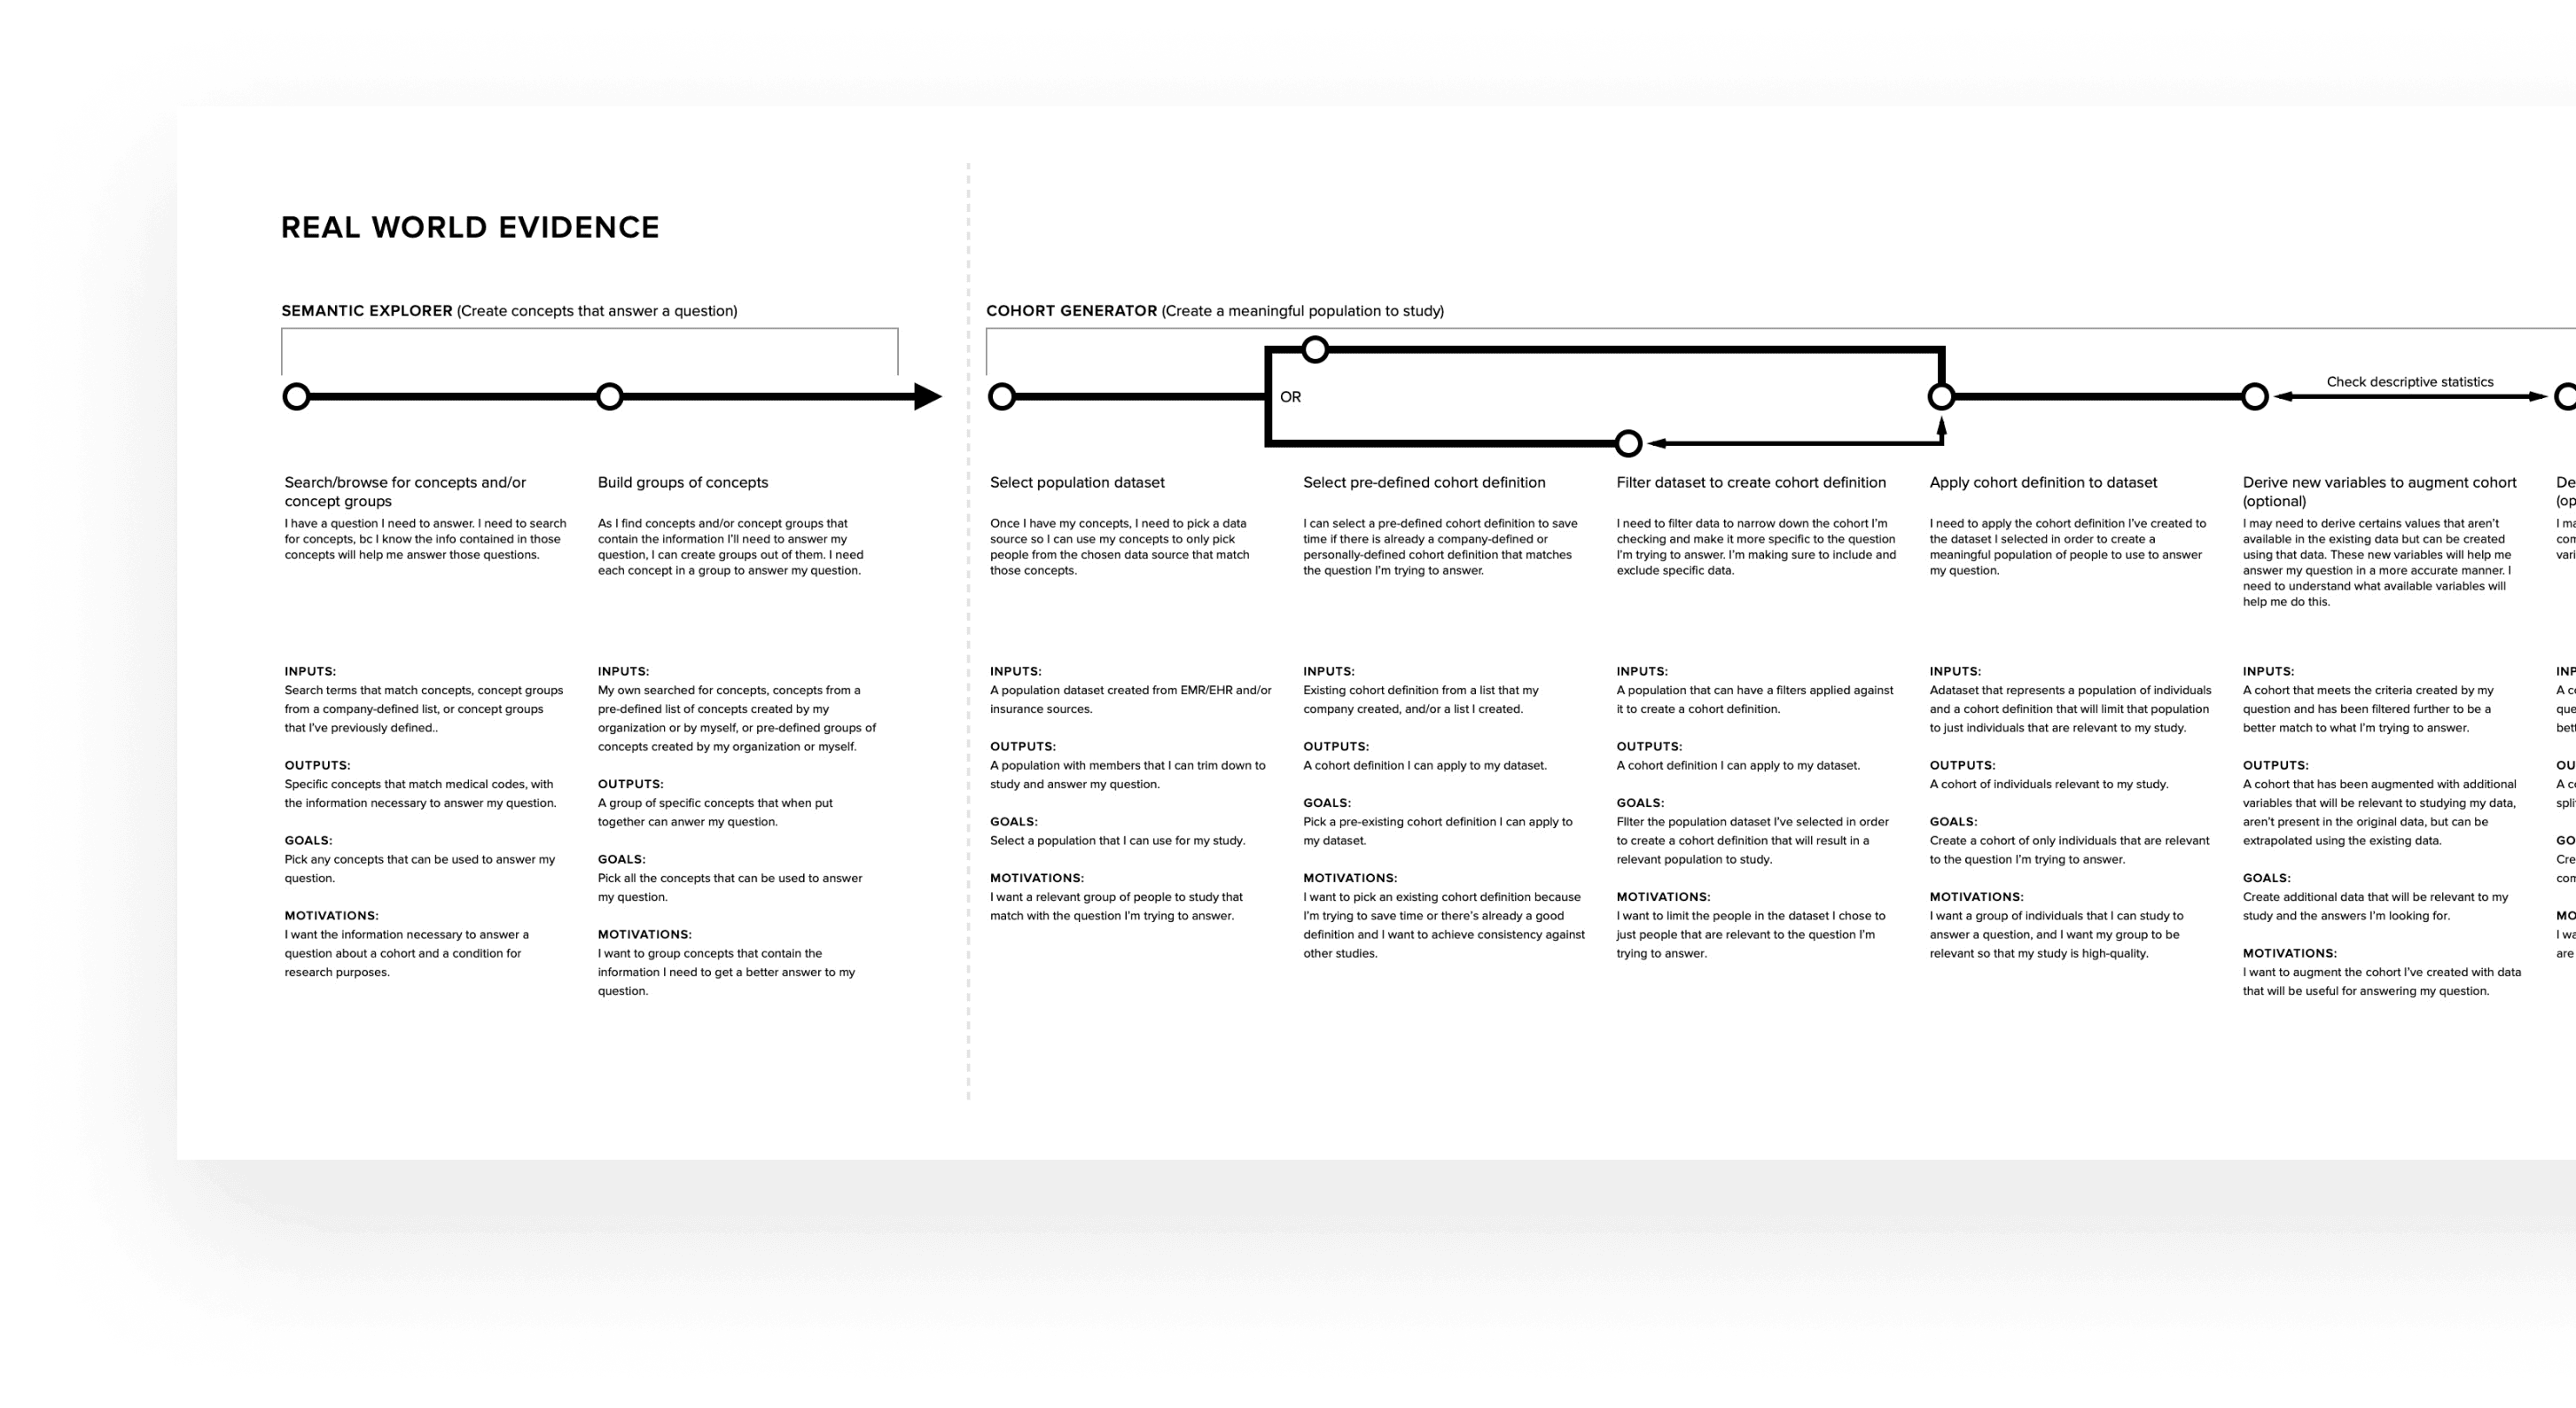
Through multiple workshops and iterations, we created a user journey map that helped the team visualize and align on the existing process. This map became the foundation for our design decisions, ensuring the future product met the needs of all stakeholders.

Ideation & Iteration

Once we aligned on the existing journey, it became clear that the future product would focus on two core areas:

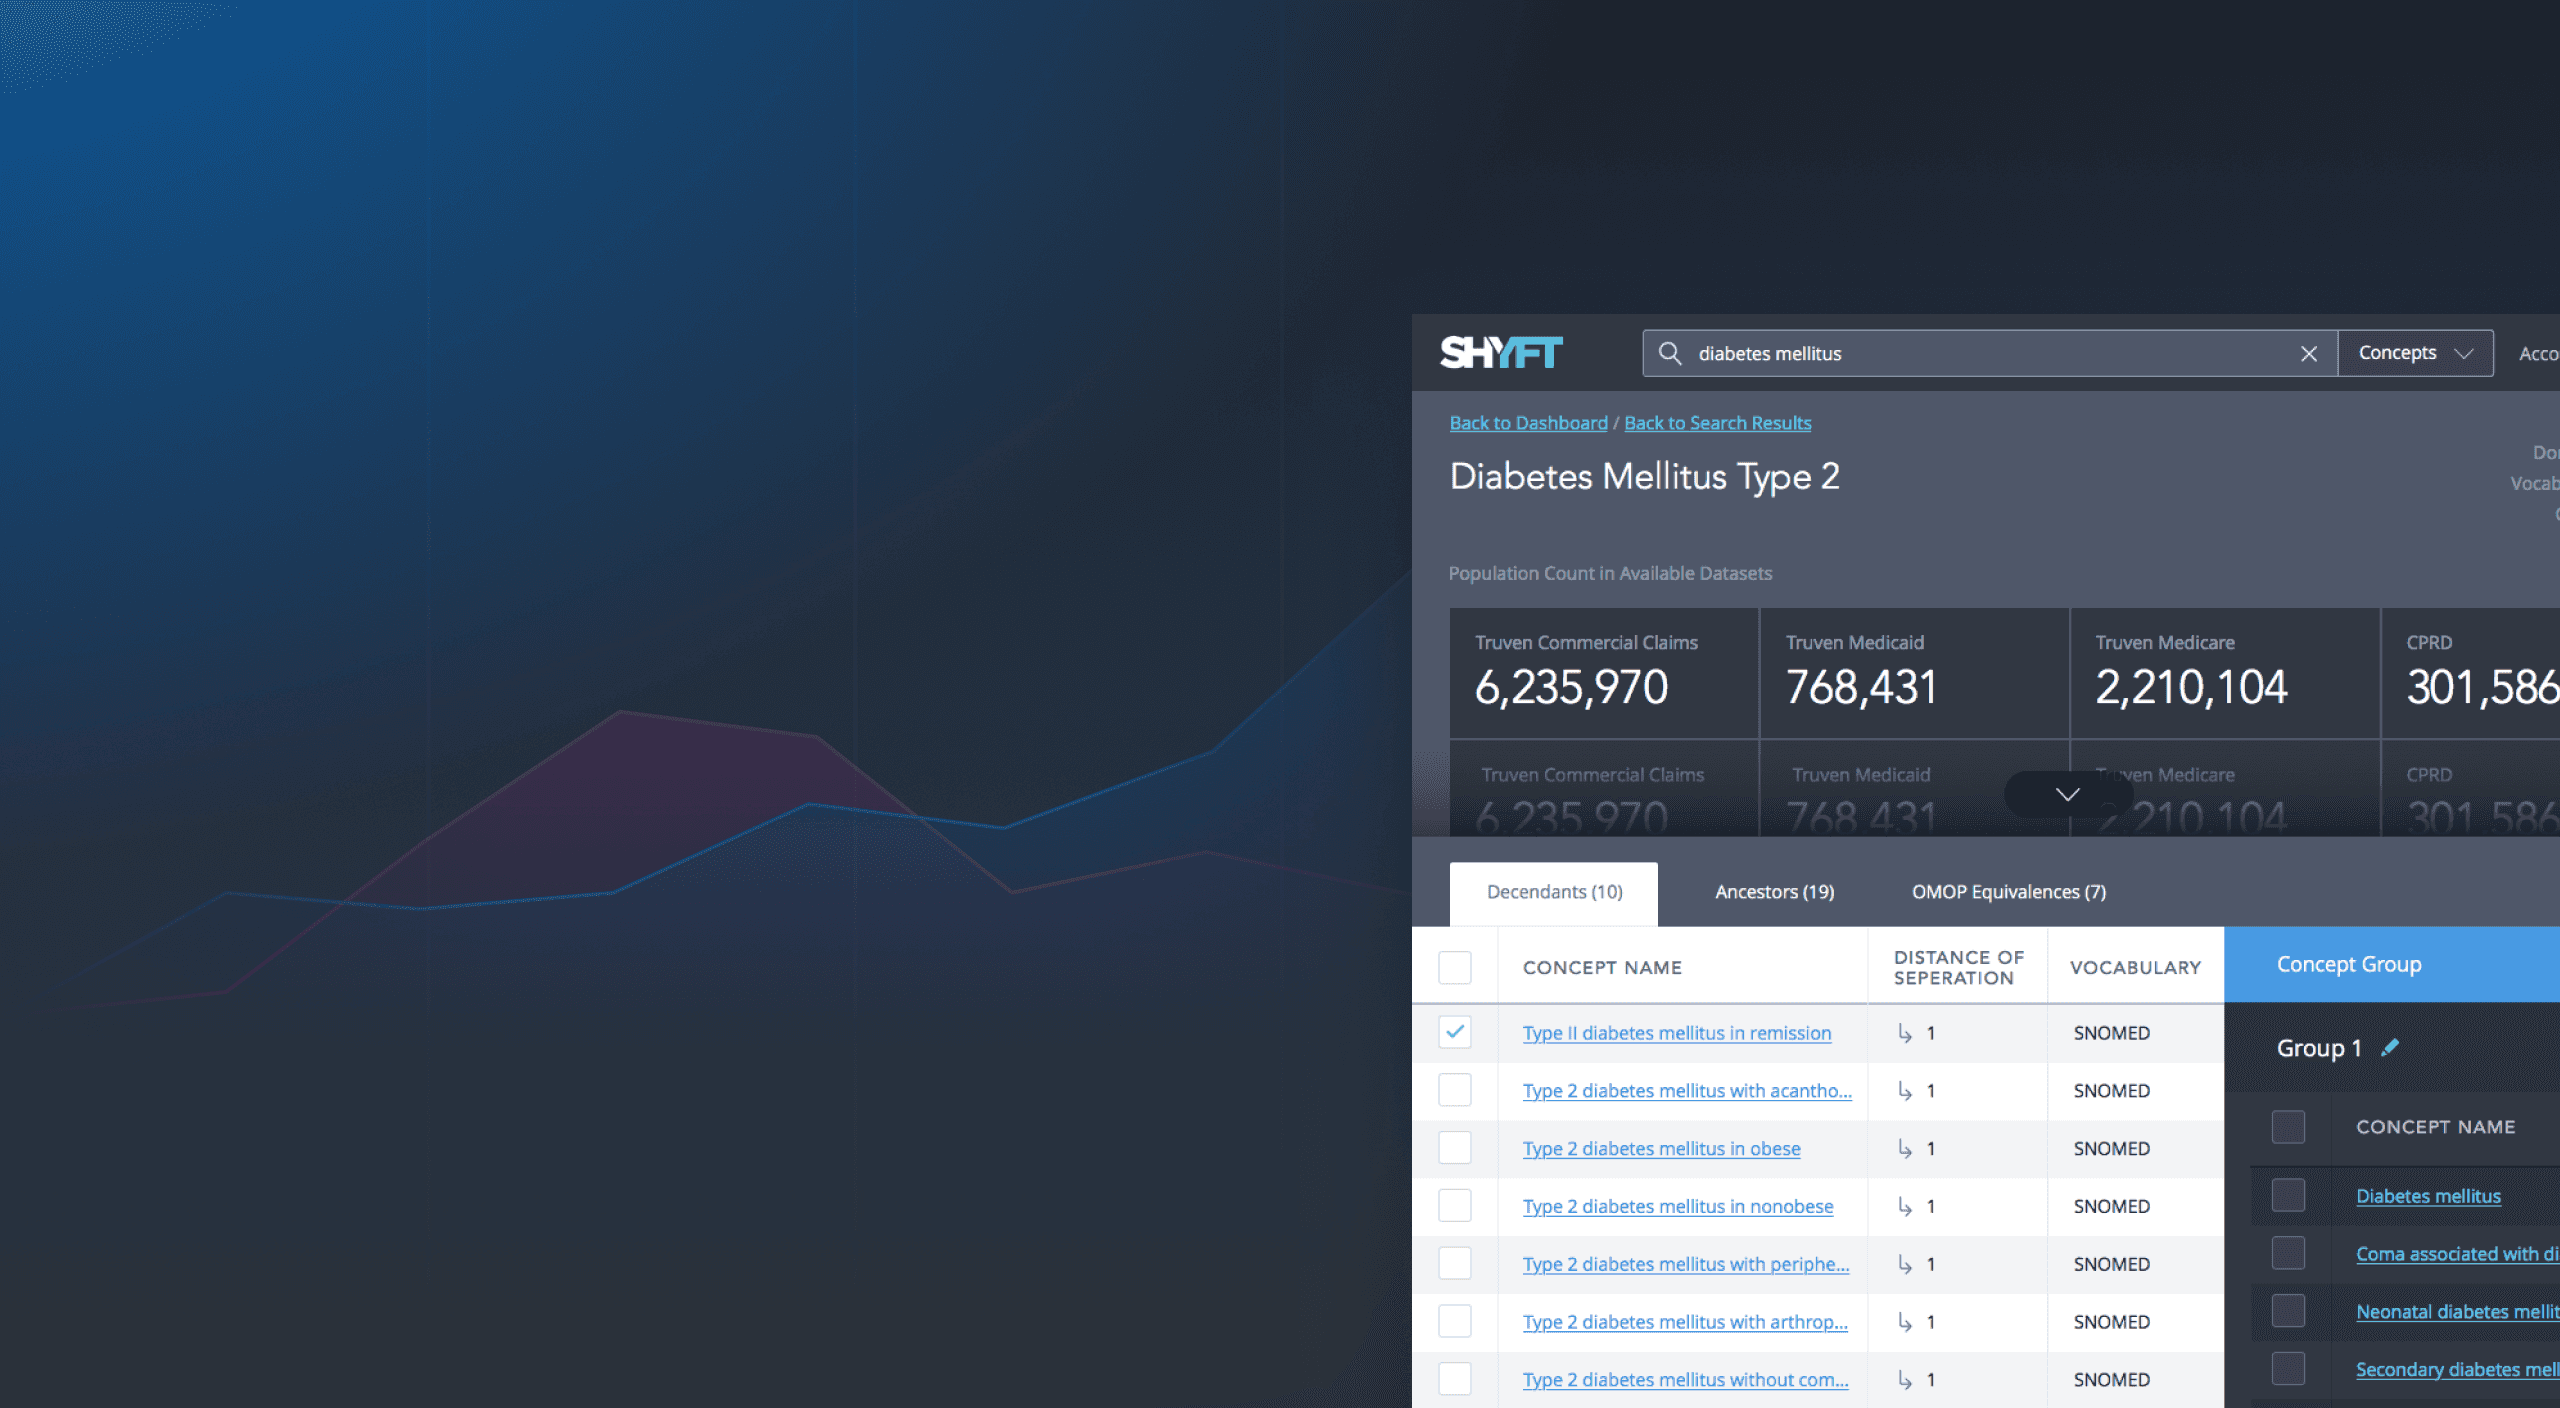
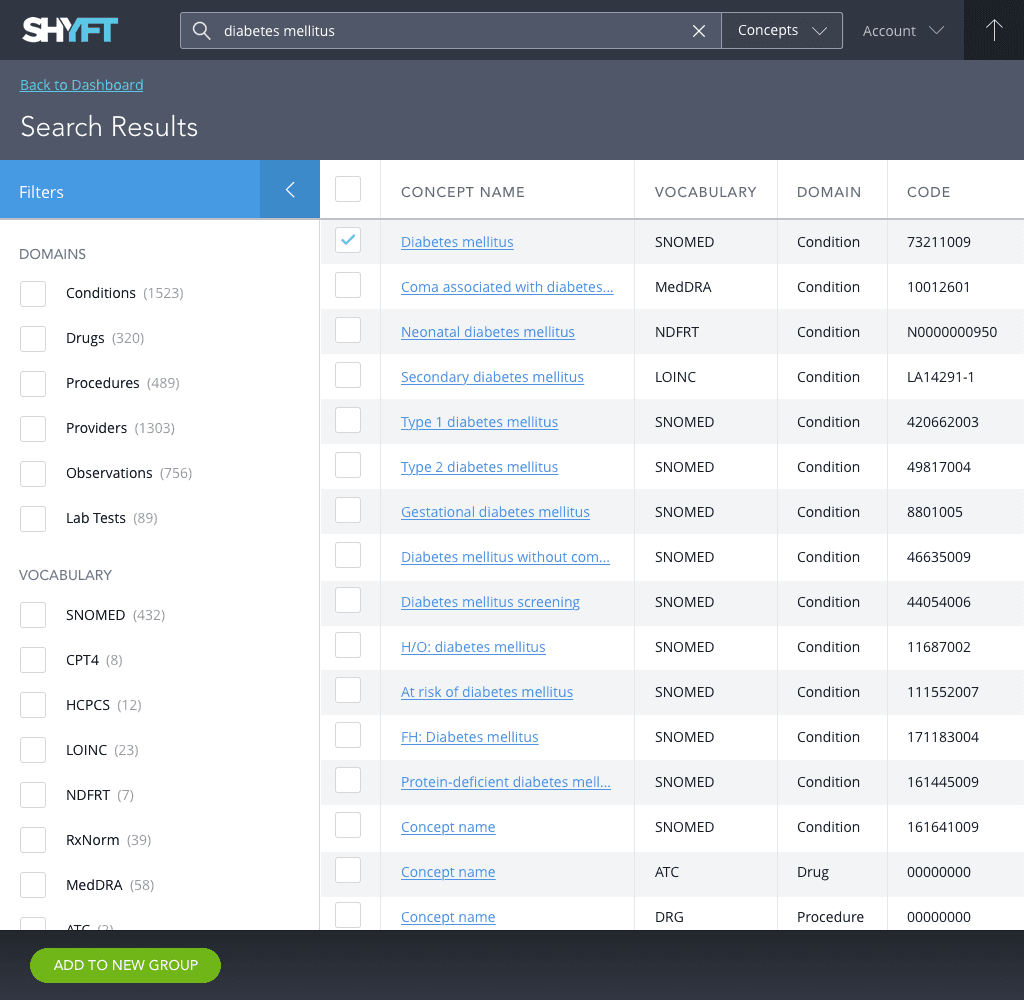
  • Semantic Explorer: Enabling users to search, browse, and group medical concepts to define diseases.

  • Cohort Generator: Allowing users to define, filter, and refine patient populations without technical expertise.


The primary focus of the engagement was to bring these two experiences to life with seamless integration. We rapidly iterated on solutions guided by two key interaction principles based on user needs:

  • Non-linear Workflow: Supporting users in working on multiple projects simultaneously with easy task navigation.

  • Guided Experience: Providing assistance for non-expert users while enabling expert users to navigate with minimal interference.

Through multiple rounds of sketching, wireframes, and testing, we developed a step-by-step interface that seamlessly integrated with the Semantic Explorer, guiding users through the cohort creation process. Inspired by visual drag-and-drop coding tools and consumer tax software, the interface allowed users with minimal technical knowledge to tackle the complex task of defining cohorts.

Outcomes

Outcomes

Outcomes

  • Designed a guided, non-linear experience for flexible navigation.

  • Designed a guided, non-linear experience for flexible navigation.

  • Designed a guided, non-linear experience for flexible navigation.

  • Balanced simplicity for non-technical users with functionality for technical users.

  • Balanced simplicity for non-technical users with functionality for technical users.

  • Balanced simplicity for non-technical users with functionality for technical users.

  • Developed an adaptive, contextual UI to reduce clutter and maximize workspace.

  • Developed an adaptive, contextual UI to reduce clutter and maximize workspace.

  • Developed an adaptive, contextual UI to reduce clutter and maximize workspace.

  • Seamlessly integrated the Semantic Explorer and Cohort Generator.

  • Seamlessly integrated the Semantic Explorer and Cohort Generator.

  • Seamlessly integrated the Semantic Explorer and Cohort Generator.

  • Achieved alignment among stakeholders.

  • Achieved alignment among stakeholders.

  • Achieved alignment among stakeholders.

Refining the Vision

Iteration continued while we focused on the aesthetic design, aiming for a clean look that also embodied SHYFT's bold brand identity.


Feedback from testing consistently reinforced the product’s value in saving time and simplifying complex workflows, bringing the vision closer to reality.

Working closely with stakeholders and keeping researchers' challenges front and center, we delivered a solution that exceeded expectations and accelerated life-saving therapy development, enabling a 92% increase in 'submission-ready' study generation compared to the industry standard.

Our focus on simplifying the user journey and aligning with stakeholders' needs created an impact in the life sciences industry, contributing to SHYFT Analytics' successful acquisition by Medidata Solutions.

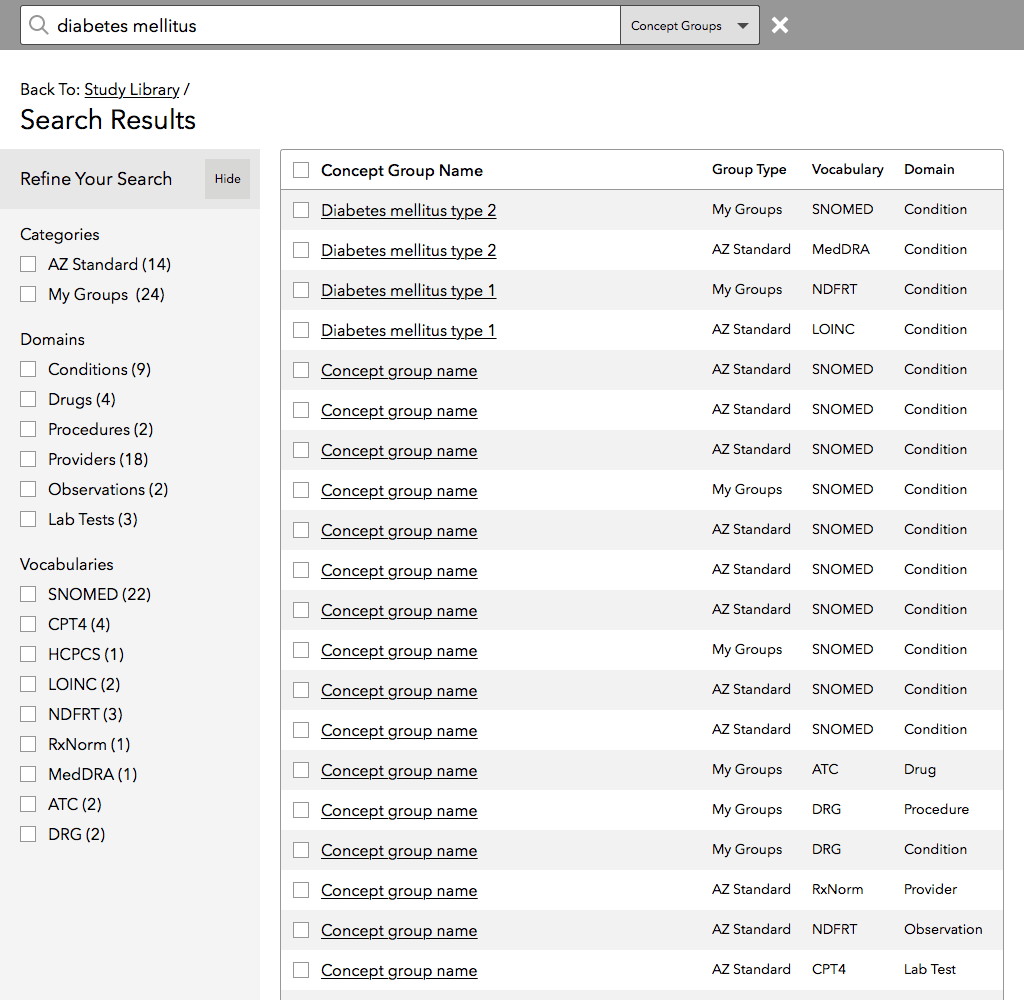
Search results could be filtered by standardized categories or user created groups, among other options.

Sticky contextual action bar.

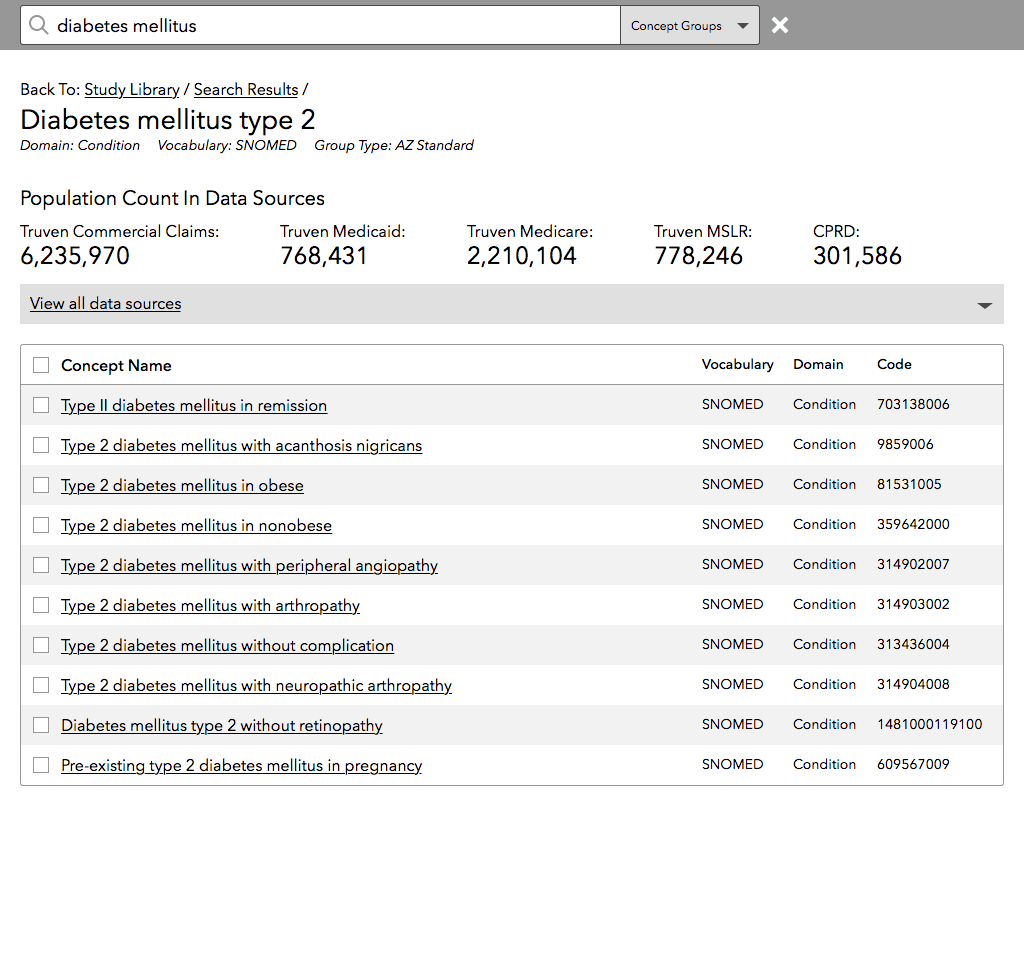
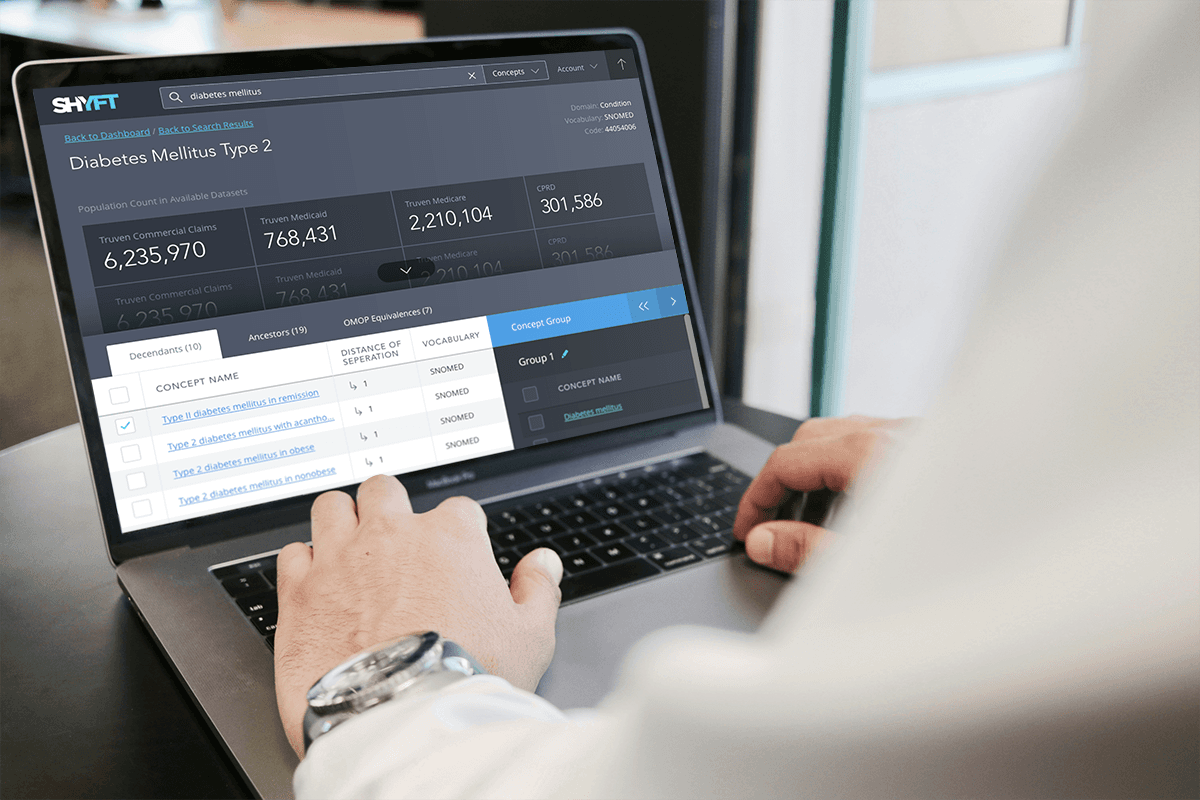
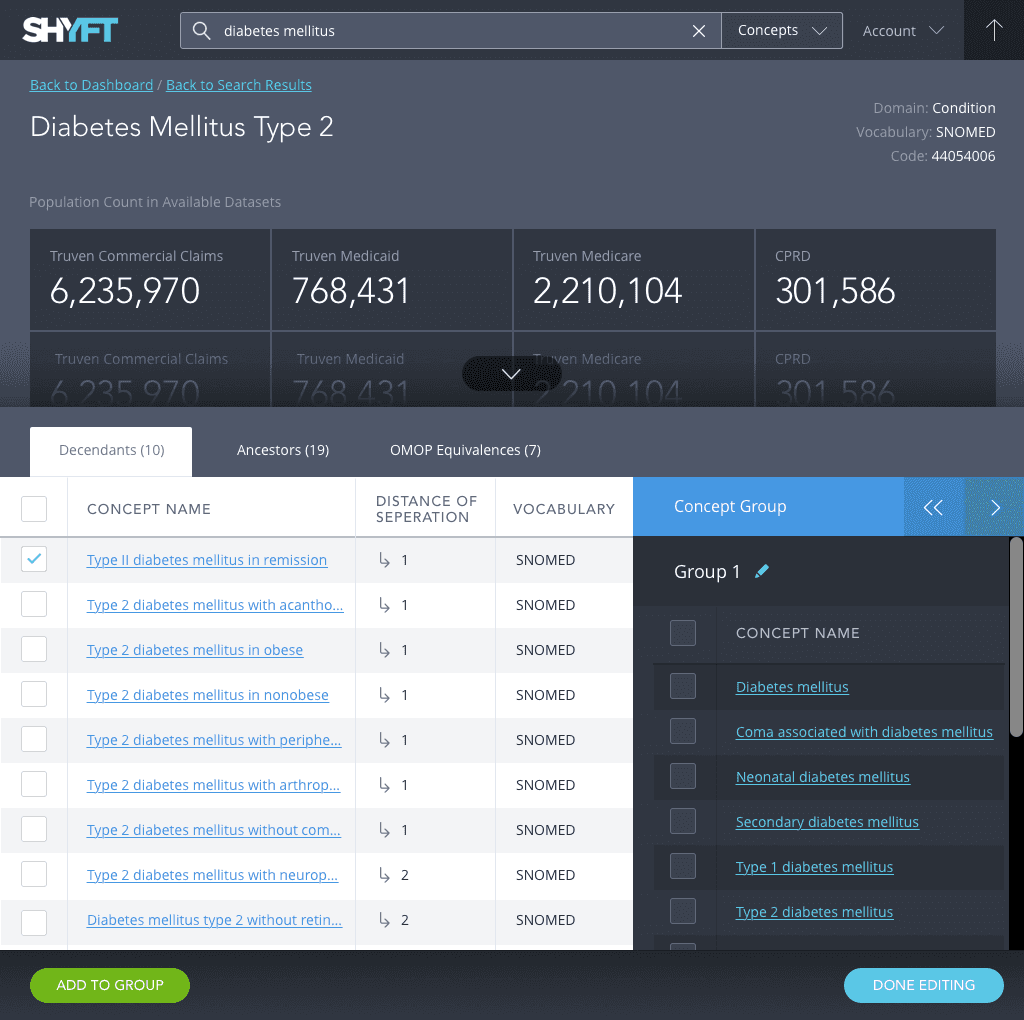
Concept details displayed the population count in data sets, giving researchers a quick sense of scale.

Surfacing related concepts expedited the search process without needing to recall each one independently.

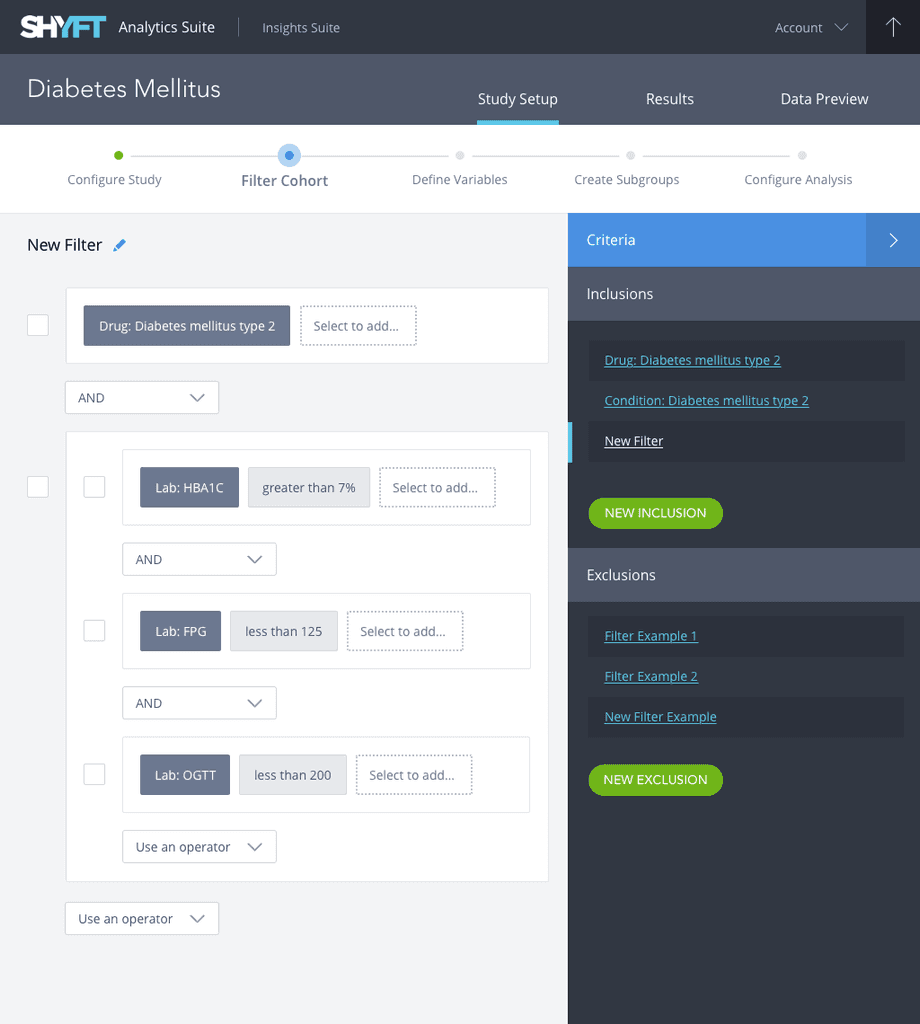
Guided process for configuring a study, with the flexibility to return to any step at any time.

The interface was context sensitive surfacing relevant actions only when needed.

The interface was context sensitive surfacing relevant actions only when needed.

Contextual building blocks panel with direct access to the Semantic Explorer.

Inline adjustments for criteria blocks.

Inline adjustments for criteria blocks.

Inline adjustments for criteria blocks.

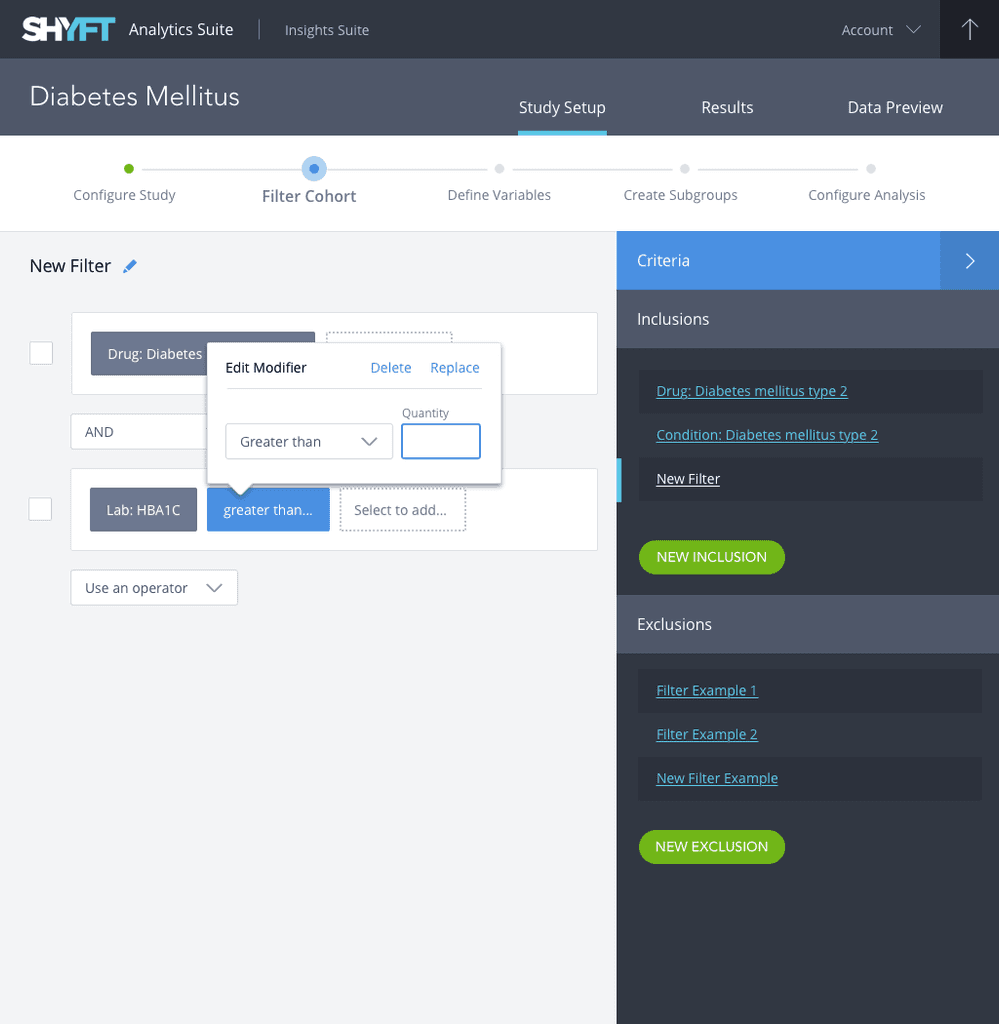
Grouping study criteria allowed for clear control over study logic.

These larger criteria groups could be collapsed into a single descriptive block which reduced visual clutter and could relocated easily.

Styled High Charts

for study results

Styled High Charts for study results

* Photo of technical clinical researcher based on real-world personas, thoughtfully brought to life using AI. Thanks for enjoying.

Let’s build something great together

Let’s build something great together

Let’s build something great together

I’m available for full-time and contract opportunities.
Contact me to collaborate on your next big idea!

I’m available for full-time and contract opportunities. Contact me to collaborate on your next big idea!

I’m available for full-time and contract opportunities. Contact me to collaborate on your next big idea!

I’m available for full-time and contract opportunities. Contact me to collaborate on your next big idea!